Solana Faces Critical $133 Support Test as Kalshi Integration Brings Fresh Institutional Interest
Solana is at a turning point right now. The network is becoming more popular thanks to Kalshi's prediction market integration, and the price
Quick overview
- Solana is experiencing a pivotal moment as its price tests critical support levels amid increased popularity from Kalshi's prediction market integration.
- Kalshi has launched tokenized event contracts on Solana, allowing users to trade on various events while enhancing privacy compared to competitors.
- Technical analysis indicates that if Solana maintains support above $133, it could rally towards the $145-$150 resistance zone, while failure to hold could lead to a drop below $110.
- Bullish signs are emerging with higher-low patterns suggesting accumulation, while liquidity data shows significant orders between $130 and $150.
Solana SOL/USD is at a turning point right now. The network is becoming more popular thanks to Kalshi’s prediction market integration, and the price is testing important support levels that could decide where it goes next.

Kalshi Brings Prediction Markets to Solana Blockchain
In a big step forward for Solana’s ecosystem, the predictions platform Kalshi has released tokenized versions of its event contracts on the blockchain. This is a smart move into the cryptocurrency industry. Users may now exchange tokenized bets on U.S. elections, sports, and other events directly on-chain. This could give them an edge over competitors like Polymarket by giving them more privacy.
John Wang, Kalshi’s head of crypto, says that the connection is meant to take advantage of billions of dollars in liquidity in the crypto market and let developers make third-party interfaces using Kalshi’s orderbook. According to reports, the DeFi protocols Jupiter and DFlow will connect the company’s off-chain orderbook to Solana’s on-chain liquidity, making trading easier.
The timing is interesting because Kalshi’s business has grown quickly after a court judgment allowed political event contracts. The platform recently raised $1 billion in a funding round led by Sequoia Capital and CapitalG. This brought its value to $11 billion and put it in the same league as big competitors in the prediction market business.
SOL/USD Technical Analysis Points to Critical Decision Point
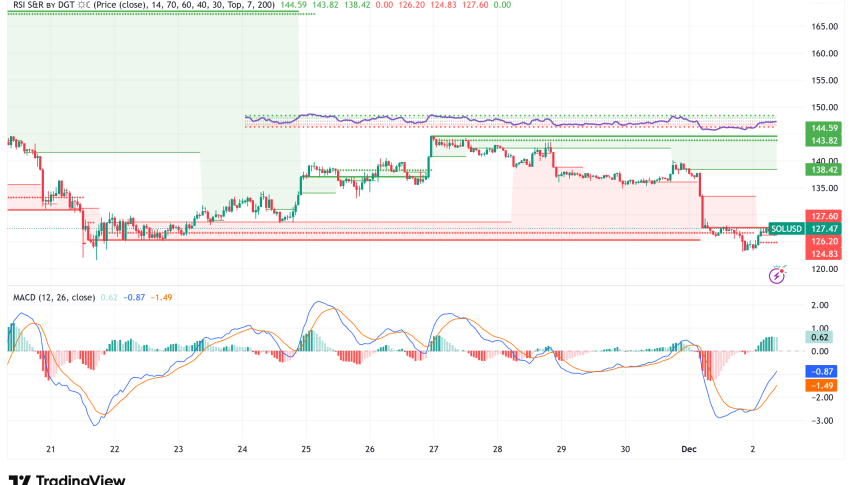
At the time of writing, Solana is worth about $127. It has been very stable over the previous 24 hours, even though the market as a whole has been very volatile. But technical signs show that the cryptocurrency is at a point where it might either go up or down, and this will probably decide which way it goes in the near future.
Support and Resistance Levels Define the Battleground
The $133 zone has become the most important support level, and traders are watching intently to see if buyers can hold this area. The liquidity data shows that there are a lot of orders stacked up between $130 and $150, with the most orders around the $130 handle. In the past, these liquidity shelves have acted like magnets, pulling price action before big moves.
Recent price movement reveals that SOL is falling from the 20-day exponential moving average at $140, which is putting pressure on the $126 support. If this level doesn’t hold, analysts say prices might drop below $110, with strong support not showing up until $95.
But there are bullish technical signs forming below the current price levels. Higher-low patterns signal that accumulation may be happening, and traders say that based on historical data, SOL looks “massively undervalued.” The SOL/BTC pair is still trading in a broad range, which is a pattern that has come before large USD rallies when momentum returns.
Solana Price Prediction: Path to $150-$165 Takes Shape
From a number of technical points of view, the forecast is the same: if Solana stays above current support, it looks more and more likely that it will rise toward $145–$150 in the near future.
Bullish Scenario: Breaking Above Resistance
If the price stays above $133, it would confirm the basing pattern and could start moving toward the $145-$150 resistance zone. If the price breaks above the 20-day EMA at $140, that would be the first sign of a bullish turnaround. This might push the price toward the 50-day simple moving average at $163.
Beyond $150, liquidity maps show a vacuum zone that goes all the way to $165. In this area, there is less liquidity, which might let prices rise quickly. Analysts say that keeping the positive structure might possibly put SOL in a position to return to the expansion zones that were last witnessed in 2021–2022.
Bearish Scenario: Testing Deeper Support
If the price doesn’t hold around $133, it will move down to lower support levels at $128 and $121, which are also historically crucial bounce areas. If the price stays below $126 for a long time, it could drop faster toward $110, with $95 being a key level of structural support.
- Check out our free forex signals
- Follow the top economic events on FX Leaders economic calendar
- Trade better, discover more Forex Trading Strategies
- Open a FREE Trading Account
- Read our latest reviews on: Avatrade, Exness, HFM and XM
Related Articles
Sidebar rates
Related Posts
