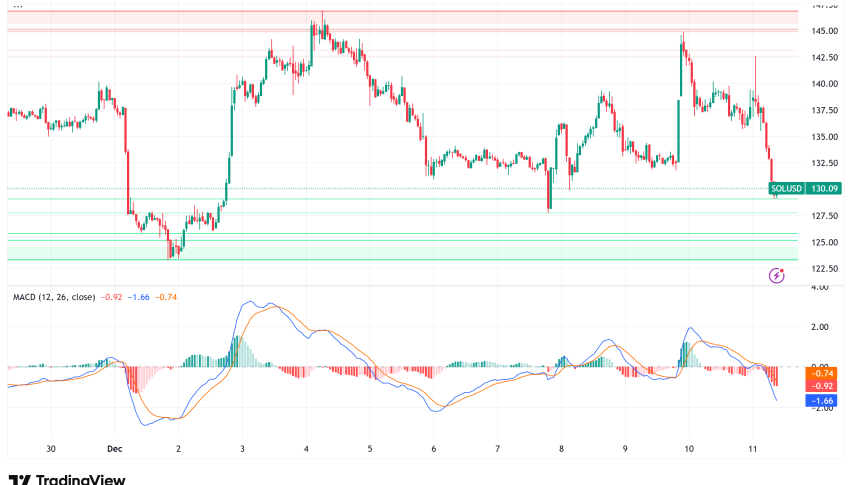
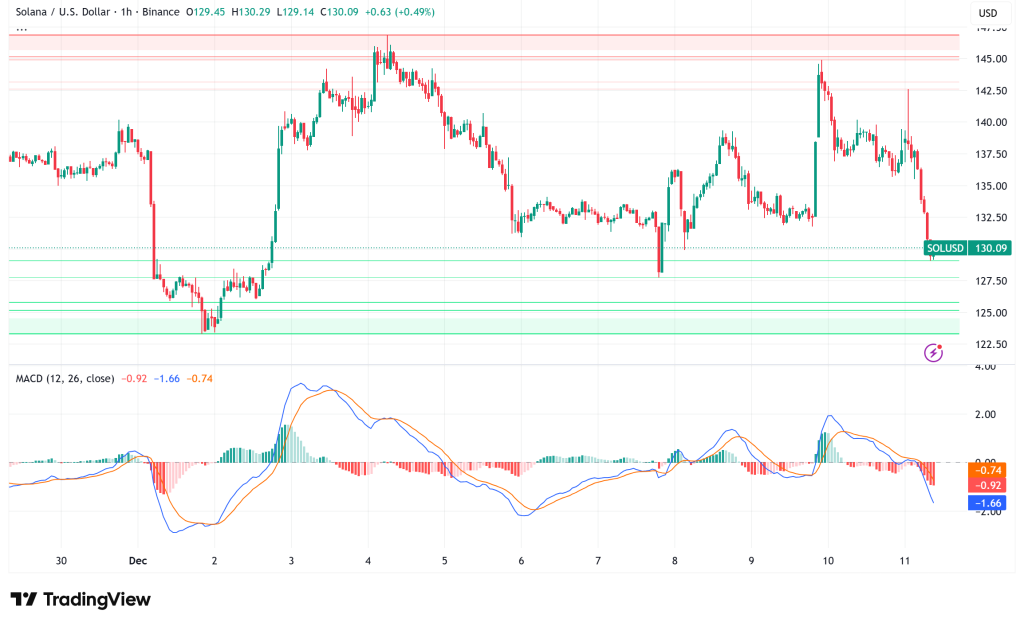
Solana Faces Critical Test at $129 as $28M Whale Buy Clashes With Liquidity Crisis
The price of Solana (SOL) is $129, which is down more than 7% in the last 24 hours. This is because the cryptocurrency is stuck between two
Quick overview
- Solana's price is currently $129, down over 7% in the last 24 hours due to conflicting market forces.
- Whale accumulation suggests strong conviction for a price rise, with significant withdrawals from exchanges reducing liquidity.
- Technical analysis indicates a critical resistance at $145, which, if broken, could lead to a rally towards $168.
- The market faces high downside risks if the $129 support fails, potentially triggering significant liquidations of long positions.
The price of Solana SOL/USD is $129, which is down more than 7% in the last 24 hours. This is because the cryptocurrency is stuck between two market forces that are working against each other. Big whale accumulation might mean that the market is going up, but high leverage and low liquidity are making things very unstable, which might go either way.
Whale Accumulation Signals Strong Conviction Despite Price Weakness
There was a lot of whale activity in the cryptocurrency market when a new wallet took 200,001 SOL tokens out of Binance, taking about $28 million worth of supply off of centralized exchanges. This aggressive accumulation happened right as Solana was holding its ground in a range between $126 and $145. This suggests that big holders are getting ready for a price rise.
The withdrawal makes exchanges less liquid, which has historically led to price increases when accompanied with steady buying pressure. People in the market see this as early conviction from smart investors who are getting ready for a possible trend reversal.
SOL/USD Technical Analysis: Accumulation Despite Bearish Price Action
From a technical point of view, Solana is still protecting a clean accumulation zone, and buyers are constantly turning down deeper pullbacks below the $126–$145 area. The chart shows that the lower boundary has formed higher lows over and over again. This means that the structure is slowly getting better, even if it has been under pressure lately.
The MACD line rising over the signal line shows that the MACD indicator is gaining momentum again, which means that buyers are taking back control of short-term price movement. Before a big change in momentum, histogram bars usually loiter near the neutral zone. This is in line with the tight accumulation structure that has been seen in recent trade.
If there is a confirmed breakout above the $145 resistance level, it might start a rally toward $168, which is the next big liquidity cluster. But the current resistance is still keeping prices from going up, so the $145 level is very important for bulls who want to start a markup phase.
SOL Liquidity Crisis Reaches Bear-Market Depths
On-chain data shows that Solana’s 30-day realized profit-to-loss ratio has stayed below 1 since mid-November, which is very different from whale optimism. This pattern, where more losses are happening than gains, is common during bear markets when liquidity contracts. It shows that the market is going through what experts call a “full liquidity reset.”
Market-makers have stepped back a lot, making order books thinner even though realized volatility is going up. This makes the market very susceptible to unexpected changes, especially around concentrated liquidation clusters. The scenario is made worse by a drop in futures open interest and liquidity pools that aren’t working together across trading venues.
Solana Derivatives Markets Signal Mounting Pressure on Short Sellers
Recent data on liquidations shows how positions are changing. For example, $293,020 in short positions were closed, while only $132,340 in long ones were closed. Binance had the biggest difference, with $167,070 in shorts and $64,510 in longs. This shows that traders who bet on breaks at $138.64 have been caught multiple times as the range floor stands firm.
The fact that so many liquidations are happening close to current price levels shows how hard it is for sellers to keep prices going down. Around $129 is a really dangerous area because if the stock tests that support again, about $500 million in long positions will have to be sold. In the last 24 hours, $15.6 million in SOL contracts were liquidated. The market is yet open to cascade liquidations in either way.
On-Chain Activity Shows Growing Organic Demand
Even if things are tough, Solana’s decentralized exchange environment is becoming better. The 24-hour volume on DEX was $3.798 billion, and the seven-day volume was $24.613 billion, which is a 12.76% rise from the previous week. This rise shows that more and more people are using on-chain trading platforms that don’t require custodians.
With a DEX-to-CEX dominance of 16.11%, this shows that there is more organic demand than speculative leveraged positioning. More decentralized trading activity frequently means that people will keep using the network, which makes the ecosystem’s liquidity base stronger even when centralized venues are under pressure to withdraw.
Spot ETFs have also seen over $17 million in inflows this week, which shows that institutions are still buying even though the market is under a lot of stress.
Solana Price Prediction: Critical Juncture Ahead
Solana’s next move depends on how well it can deal with the conflict between bullish accumulation indications and a lack of liquidity. There is a case for a reversal because whales are buying, there are positive momentum signs, and the order flow is mostly buyers. However, the historically low liquidity and high leverage make the downside risk quite high.
Bull Case: If buyers can get through $145 with a lot of volume, Solana may quickly move from accumulation to markup, with a target of $168. Once resistance breaks, the combination of less supply on exchanges, more activity on DEXs, and short-seller liquidations would probably speed up the upward trend.
Bear Case: If the $129 support level isn’t held, the $500 million in leveraged long bets that are congregated at that price point could be forced to sell at a huge loss. If this happens, SOL would probably drop to the lower end of its range, which is at $126 or lower. This may mean a loss of 10-15%.
- Check out our free forex signals
- Follow the top economic events on FX Leaders economic calendar
- Trade better, discover more Forex Trading Strategies
- Open a FREE Trading Account
- Read our latest reviews on: Avatrade, Exness, HFM and XM
Related Articles
Sidebar rates
Related Posts
