Bitcoin Tests $94,000, Technical Indicators Signal Potential Breakout Despite Liquidity Concerns
Bitcoin is now trading above $94,000, which is the highest it has been since mid-December 2025 and a new year-to-date high. During Monday
Quick overview
- Bitcoin is trading above $94,000, marking its highest level since mid-December 2025 and a new year-to-date high.
- Institutional interest remains strong, with Strategy purchasing $116 million worth of Bitcoin, reinforcing confidence in its long-term value.
- Despite the bullish sentiment, concerns arise from declining trading volumes, which could indicate thin liquidity and potential volatility.
- Traders are divided on Bitcoin's trajectory towards the $100,000 mark, with some predicting a breakout while others warn of a possible price drop.
Bitcoin BTC/USD is now trading above $94,000, which is the highest it has been since mid-December 2025 and a new year-to-date high. During Monday’s trading session, the top cryptocurrency hit $94,026 on Bitstamp. This was part of a larger risk-on rally that saw the S&P 500 and Nasdaq Composite gain 1% and gold rise above $4,455 per ounce. Geopolitical events, especially US actions in Venezuela, led to a rise in investor confidence, which led to this coordinated increase across asset classes.
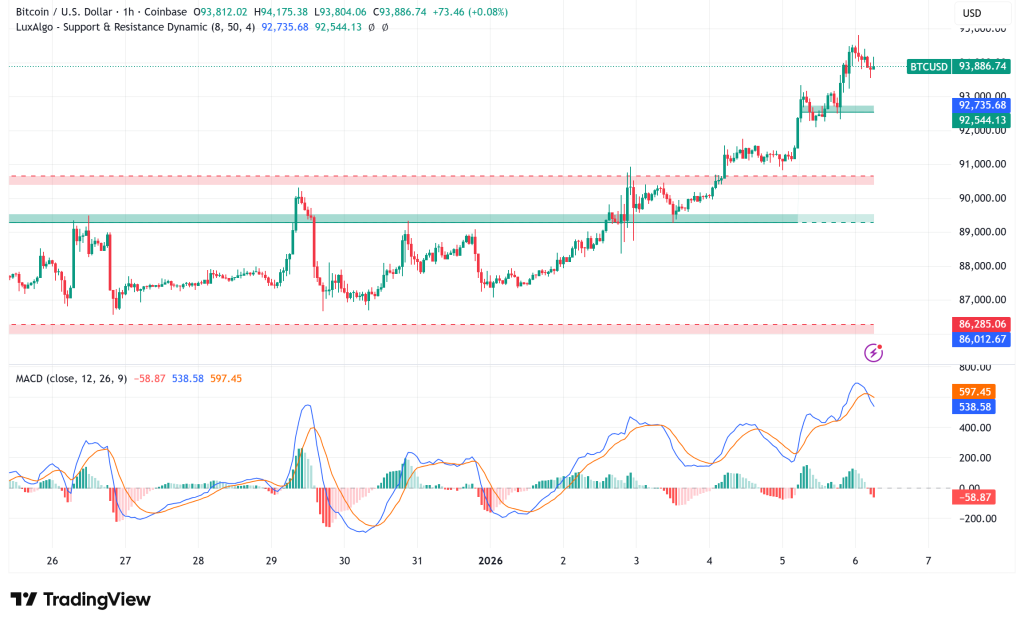
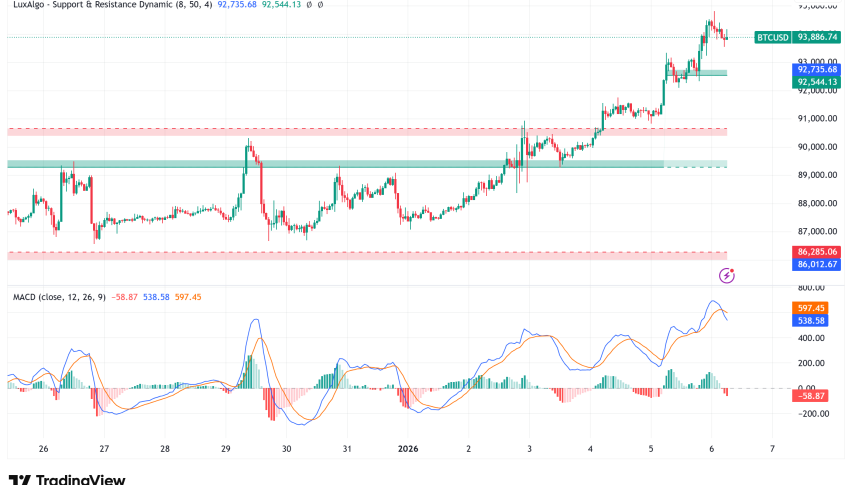
The digital asset has effectively recaptured several important technical levels, such as the 50-day exponential moving average at $91,600 and the yearly open for 2025 at $93,500. Bitcoin has been stuck between $86,000 and $90,000 for almost six weeks. Now, observers say it is moving from a “weak” phase to a “strength” phase.
Institutional Backing: Strategy Continues Aggressive Bitcoin Accumulation
Adding to the bullish story, Strategy (formerly MicroStrategy) started 2026 by buying $116 million worth of Bitcoin, or 1,283 BTC, at an average price of about $90,000. The corporation currently owns 673,783 BTC, which is worth $62.6 billion. This makes it the largest corporate Bitcoin holder in the world. Even if Bitcoin prices fell by more than 23% in the fourth quarter of 2025, Strategy’s continuous accumulation shows that institutions believe in Bitcoin’s long-term value proposition.
BTC/USD Technical Analysis: Bullish Structure Emerges But Overbought Signals Flash Warning
Axel Adler Jr., a Bitcoin researcher, said that BTC’s structure shift indicator, which combines channel position, moving-average trends, and directional movement, has definitely changed direction. The indicator rose from below -0.3 in late December to +0.73 by early January, which was the same time that Bitcoin rose from $87,500 to its present high. In the past, readings above +0.5 have been linked to long-term uptrends.
The current range for momentum indicators is 0.85 to 0.89, which is substantially above the three-month average of 0.5 but not too high. Channel placement has now touched 0.99, which puts Bitcoin close to its three-week high, with range support around $85,000. This close to the range ceiling makes it more likely that there will be a short-term downturn before the market continues.
According to CryptoQuant’s on-chain data, accumulation trends have been constant, with accumulating addresses holding 2.28 million BTC, worth over $211 billion, the most ever. This steady absorption of supply shows underlying strength, but it happens against a backdrop of worrying volume measures.
Critical Concern: BTC Trading Volume Plunges to Late 2023 Levels
The biggest thing that is making Bitcoin go down is that the market is not as active as it used to be. According to Glassnode, the amount of crypto spot trading has dropped to its lowest level since late 2023. This raises severe concerns about how long the present price strength may last. Analysts say that this drop in demand is causing “increasingly thin liquidity conditions” behind the current rally.
Willy Woo, a veteran of Bitcoin, said he was worried about the weak order book liquidity. However, he thinks there will be a short-term pump in January since liquidity seems to be establishing a local bottom. When prices go up and volume goes down, it usually means that fewer people are driving price action. This can make prices more volatile and more likely to change direction suddenly.
Bitcoin Price Prediction: The $100,000 Debate, Breakout or Bull Trap?
Traders still don’t agree on which way Bitcoin is going toward the important $100,000 level. Plan C, the company behind the Bitcoin Quantile Model, says that trading that stays in a clear channel for almost six weeks is like healthy accumulation. He says that if the price breaks over $94,500, it will quickly advance toward $100,000. The longer the price stays in this range, the more likely it is that the bottom will hold.
Michaël van de Poppe, a crypto expert, agrees with this positive attitude, saying, “The last hurdle before $100K is where Bitcoin is right now.” I don’t think there will be a clear-cut, quick breakout, but I do think it will happen in the next week.
But trader Peter DiCarlo has a different view. He says that the recent bounce could be a trap to get late purchasers in before the price drops even more to $70,000. He doesn’t see a possible squeeze toward $100,000 as a sign of a fresh bull leg; instead, he sees it as a preparation for distribution.
- Check out our free forex signals
- Follow the top economic events on FX Leaders economic calendar
- Trade better, discover more Forex Trading Strategies
- Open a FREE Trading Account
- Read our latest reviews on: Avatrade, Exness, HFM and XM
Related Articles


Sidebar rates
Related Posts
