Ethereum Tests Critical $3,300 Resistance, Double Bottom Pattern Targets 20% Rally to $3,900
Ethereum (ETH) is trading above $3,200, up 1.7% in the last 24 hours. This is because the second-largest cryptocurrency is getting close to
Quick overview
- Ethereum is currently trading above $3,200, showing a 1.7% increase in the last 24 hours as it approaches a key technical inflection point.
- The cryptocurrency is forming a double bottom pattern, which could lead to a price target of $3,900 if it breaks above the 200-period EMA.
- Retail investors are driving the recent recovery, while whale wallets are showing signs of distribution, raising concerns about the sustainability of the rally.
- The upcoming days are critical for Ethereum's price direction, with a need to maintain above $3,300 to confirm bullish momentum.
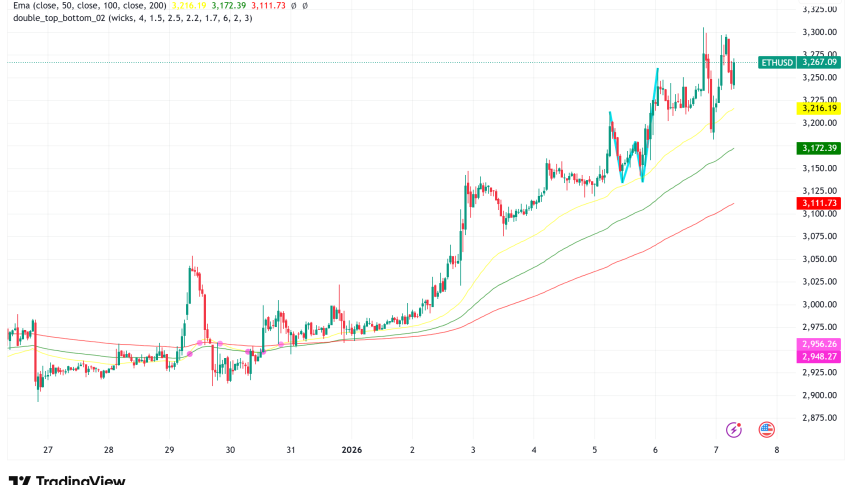
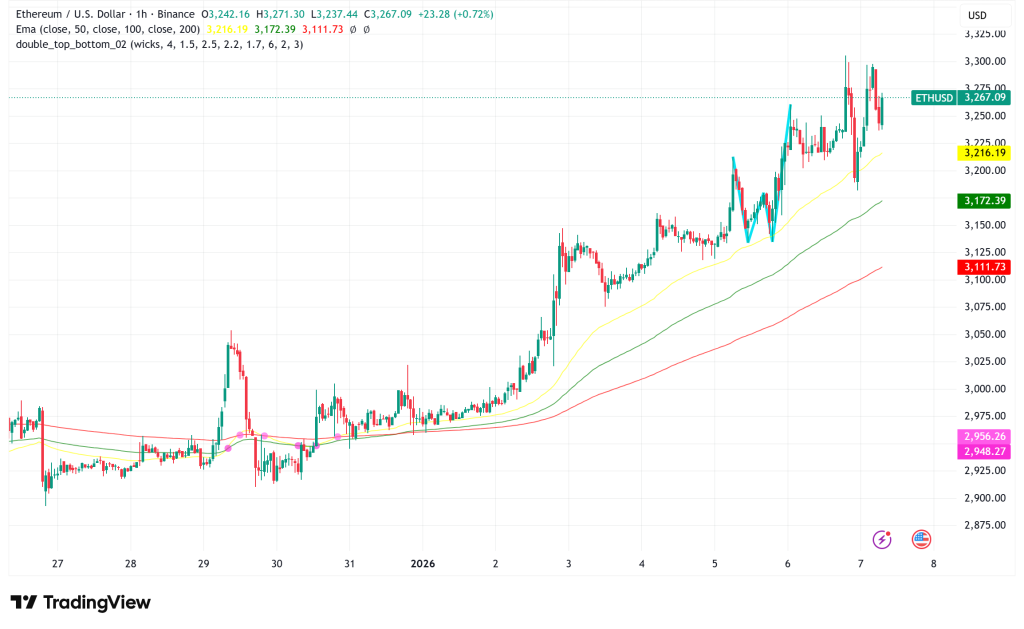
Ethereum ETH/USD is trading above $3,200, up 1.7% in the last 24 hours. This is because the second-largest cryptocurrency is getting close to a key technical inflection point that could shape its path through early 2026. The price structure of the altcoin shows that it is forming a double bottom pattern that might lead to big gains. However, this will only happen if it can regain a key long-term trend indication.
ETH/USD Technical Setup Points to $3,900 Target
Ether’s daily chart shows a strong double bottom pattern that has evolved over the course of Q4 2025, showing that a major demand zone is still being defended. If this traditional reversal pattern is verified by a strong breakout, the price target is about $3,900, which would be a possible 20% gain from where it is now.
The 200-period exponential moving average (EMA) is the next big problem. It has been a strong barrier since the larger trend turned negative in November. ETH has tried to go back to this level twice before, but both times it was turned down, which led to more losses. The cryptocurrency is now going through its third test of this important technical hurdle.
If the price stays above the 200-EMA every day, it would mean that long-term trend resistance has been broken and the double bottom breakout is real. From a market structure point of view, a strong close over $3,300 would also be a positive breach of structure on the daily period, which would give more support to the idea that the market is reversing.
Retail Investors Lead Recovery Amid Whale Distribution
Cumulative Volume Delta (CVD) analysis shows what kind of rally this is. CryptoQuant’s data shows that both spot and futures taker CVDs have been going up over the previous three weeks. This shows that there is steady demand in both cash and leveraged markets. This kind of alignment usually means that the customer is really sure about their decision, not just covering their shorts for a short time.
But Hyblock Capital’s wallet cohort study shows that there is a difference under the surface. This week, whale wallets with between $100,000 and $10 million saw a negative $40 million total differential, which means that larger investors were selling more than buying. Retail traders ($1,000–$10,000) and mid-sized investors ($10,000–$100,000) had small positive deltas of $3.40 million and $28 million, respectively, over the preceding six days.
This pattern of distribution shows that smaller investors are behind Ethereum’s recent rebound, which raises doubts about how long it can last without the participation of whales or institutional investors. If ETH can break cleanly over the 200-EMA, it might decide if bigger players come back into the market or whether the price action stops below resistance.
Ethereum Ecosystem Demonstrates Fundamental Strength
Ethereum’s fundamental position has gotten a lot stronger, not just because of technical reasons. The Ethereum cornerstone said that 2025 will be a turning point year for the network, when it “solidified itself as the secure foundation for our growing digital civilization.” The blockchain ended the year with more than $99 billion in total value locked up in its DeFi ecosystem. This is more than nine times the value of the next-largest Layer 1 competitor.
The network also handled around $18.8 trillion in stablecoin settlements and had a huge presence in the rapidly growing prediction markets industry, with almost $20 billion in betting volume across the base layer and Layer 2 solutions. Major protocol modifications like Pectra and Fusaka made the network faster and made more data available. They also made the user experience better by adding account abstraction features.
At the same time, Ethereum’s average transactions per second across all rollups surpassed 5,600 TPS, showing how its Layer 2-centric roadmap can help it grow. Transaction fees for L2s fell below one cent, which was one of the key reasons why they weren’t more widely used.
Ethereum Price Outlook: Critical Week Ahead
The next few days will be very important for Ethereum’s medium-term direction. To confirm the double bottom breakout and aim for the $3,900 resistance level, bulls need to obtain a foothold above $3,300 with significant volume. The 200-EMA needs to change from being a resistance level to a support level, which would mean that the daily closes above this indicator need to happen multiple times in a row.
On the other hand, if the 200-EMA is not reclaimed, there might be another rejection and a possible retest of the double bottom’s neckline support around $2,850. The way whales are now distributed increases the chance of a drop since bigger holders may put selling pressure on rallies.
- Check out our free forex signals
- Follow the top economic events on FX Leaders economic calendar
- Trade better, discover more Forex Trading Strategies
- Open a FREE Trading Account
- Read our latest reviews on: Avatrade, Exness, HFM and XM
Related Articles


Sidebar rates
Related Posts
