Bitcoin Holds Above $91K as Accumulators Absorb 60,000 BTC Amid Competing Market Forces
Bitcoin is trading at $91,000, down 1% in the last 24 hours. The cryptocurrency is at a crucial point when a lot of people are buying it and
Quick overview
- Bitcoin is currently trading at $91,000, experiencing a 1% decline in the last 24 hours amidst mixed market signals.
- Accumulation by Bitcoin addresses has increased significantly, while miners have sold around 33,000 BTC, indicating potential selling pressure.
- Market sentiment is stabilizing with a shift from net selling to mild net buying, although overall buying pressure remains low compared to previous bull markets.
- Historical trends suggest that Bitcoin could see significant growth in 2026, but current resistance levels and geopolitical factors may impact short-term price movements.
Bitcoin BTC/USD is trading at $91,000, down 1% in the last 24 hours. The cryptocurrency is at a crucial point when a lot of people are buying it and miners are sending it out. The digital asset’s performance in early January shows that the market is changing. Competing forces make it hard to know if its recent rise to the low-$90,000 area will last.
Strong Accumulation Meets Miner Selling Pressure
On-chain data shows that accumulators acted very differently in the first six days of January. Bitcoin accumulator addresses went from holding about 249,000 BTC to 310,000 BTC, which means they took in about 60,000 BTC. This is a clear break from the period of consolidation from September to December 2025, when ownership ranged from 200,000 to 230,000 BTC.
However, miner distribution patterns are making it harder for this bullish signal to work. Around 33,000 BTC went from miner wallets to exchanges during the same time, mostly Binance. This suggests that miners are collecting winnings after the recent price rise. This kind of de-risking behavior usually happens when there is uncertainty after a rally, and it can create extra supply that could slow down upward momentum.
The most important question for the market is whether sustained demand can always take up this new supply from the sell side without lowering prices. Historical trends show that miner distribution alone doesn’t always cause sharp corrections. However, to keep prices stable, purchasing pressure must match or surpass selling flows over time.
Market Sentiment Shows Signs of Stabilization
The seven-day net taker flow sentiment data from Binance shows that the market is changing in a big way. In November, when Bitcoin’s price dropped to $84,000, there was a lot of net selling, averaging $2.3 billion a day. In January, there have been seven days of mild but steady net buying, averaging $410 million a day. This buying pressure is still low compared to prior bull market phases, but it is a big improvement after a time when selling was the main focus.
The Bitcoin Unified Sentiment Index has returned to neutral area for the first time since November. This means that fear has gone down, but hope is still low. This stabilization signals that the rally may not be becoming too hot, but it will only last if accumulation continues to outweigh distribution in the next few weeks.
Short-term momentum indicators show a cautious picture. The 30-day average return on Binance is only 0.0016, which shows that the market is not very active. On the other hand, the high volatility near 0.018 shows that the market is still very sensitive to price changes. The Sharpe-like ratio is around 0.09, which is positive but near to neutral. This means that the returns are modest when adjusted for risk, which is common in transitional market stages.
Historical Patterns Support Potential 2026 Rally
Bitcoin’s past performance following bad years can help us understand how it might do better in the future. The cryptocurrency’s value dropped by only 6.36% at the end of 2025, making it the fourth year in a row that it ended on a negative note. Bitcoin had bad years in 2014, 2018, and 2022. After that, it made 35%, 95%, and 156% increases in the following years, for an average return of about 100%.
Long-term technical models say that there is a lot of room for growth if liquidity conditions get better. The Bitcoin Decay Channel model says that the base-case value for 2026 will be between $200,000 and $300,000, with its oscillator close to 20%, which is a level that has traditionally been linked to early growth phases. However, the fact that things are stuck at or near current levels is due to delayed liquidity cycles, not a clear cyclical peak.
Geopolitical Factors Add New Dimension
Bitcoin’s rise as a possible hedge against geopolitical upheaval adds another aspect to the story of the current market. As tensions around the world rise, from trade wars to money weaponization, strategists say that Bitcoin is becoming known as a neutral reserve asset alongside conventional safe havens like gold and silver. The cryptocurrency reached a seven-week high of $94,725 on Monday before falling down. Its ability to stay strong during times of high global instability has caught the attention of institutional investors.
Bitcoin Price Outlook: Critical Levels to Watch
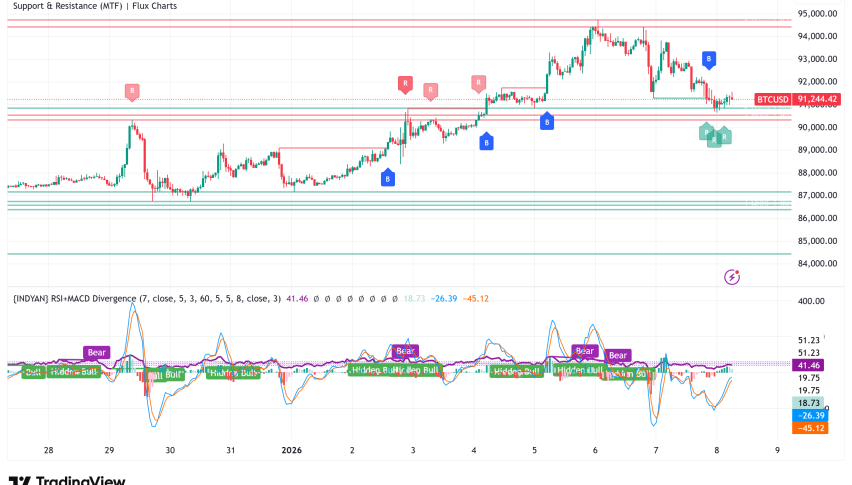
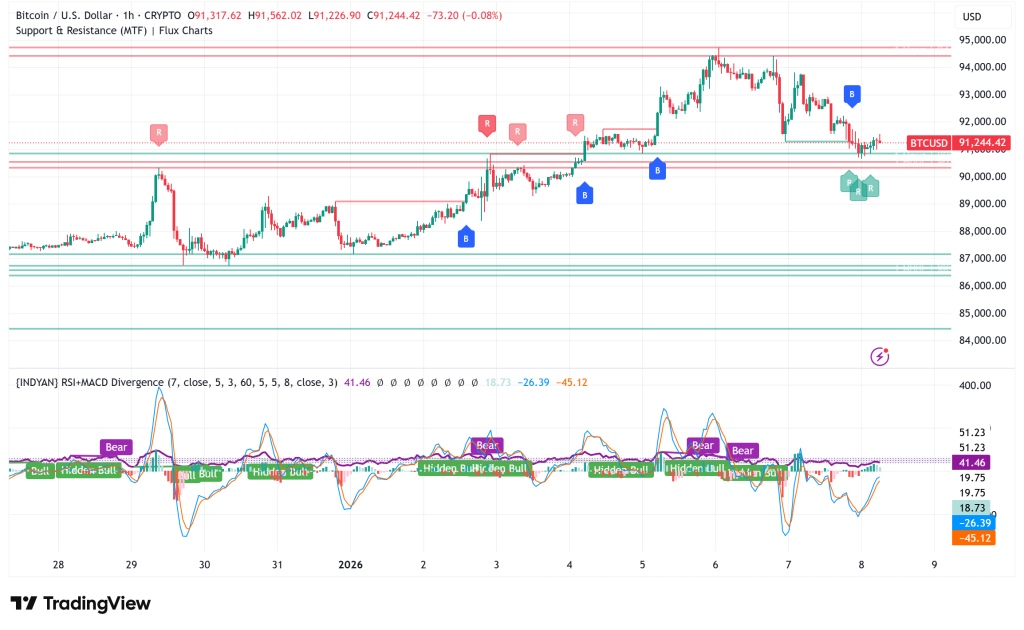
Bitcoin has a lot of resistance just below the Monday high of about $94,700. This was verified by vigorous rejection and massive spot selling, which showed that this is still a resistance zone and not a breakout point. $91,000 is the immediate support level, while $87,800 is a structurally important level that would become critical if current support fails. This level is the weak monthly low.
For bulls, whether Bitcoin can break through resistance and reach the psychological $100,000 barrier will depend on if it can keep accumulating and absorbing ongoing miner distribution. On the other hand, bears will look for weakness at the current levels and any drop below $91,000 as a sign that consolidation or a deeper pullback may be needed before the next big rise.
Bitcoin Price Prediction
In the short term, it looks like Bitcoin will stay between $87,800 and $94,700 as the market processes recent gains and sees if demand can keep up with supply. If the price stays above $95,000 with volume, it would show that the market is getting stronger and could lead to $100,000. But if it doesn’t stay above $91,000, it could go back down to the $87,800-$88,000 zone until the next move is obvious. The measured approach of accumulators and stabilizing sentiment suggests that volatility may stay high, but a significant external shock is needed for a catastrophic drop.
- Check out our free forex signals
- Follow the top economic events on FX Leaders economic calendar
- Trade better, discover more Forex Trading Strategies
- Open a FREE Trading Account
- Read our latest reviews on: Avatrade, Exness, HFM and XM
Related Articles


Sidebar rates
Related Posts
