Ethereum Tests Critical $3,100 Level as Multiple Chart Patterns Signal Potential Rally to $4,000 and Beyond
Ethereum is at a crucial point right now, with a price of about $3,100, down 1.4% in the last 24 hours. Technical signs and on-chain data
Quick overview
- Ethereum is currently priced at approximately $3,100, down 1.4% in the last 24 hours, and is 27% below its October 2025 peak.
- Open interest in Ether futures is rising, indicating that traders are returning to the market, viewing current prices as attractive for buying.
- Institutional confidence is growing, as evidenced by significant staking activity from companies like BitMine, which recently added 110,000 ETH worth $340 million.
- Technical analysis suggests Ethereum is testing a key resistance level, with potential for a breakout that could lead to significant price increases in the coming weeks.
Ethereum ETH/USD is at a crucial point right now, with a price of about $3,100, down 1.4% in the last 24 hours. Technical signs and on-chain data make it hard to tell where the second-largest cryptocurrency is headed in the near future. The price is still about 27% below its top in October 2025, but a combination of chart patterns and changes in the market structure imply that Ether may be getting ready for a big run up.
The most interesting change in ETH’s market structure is that open interest recovery and price performance are moving in different directions. Open interest for Ether futures has gone back up to levels recorded when the asset lost 38% of its value in Q4 2025, but the price is still way behind. This gap shows that traders are slowly getting back into ETH, seeing the current levels as good places to buy even if the price has been volatile lately.
Healthier Leverage Metrics Support Sustainable Recovery
Ethereum’s projected leverage ratio, which dropped from an all-time high of 0.79 on January 2 to 0.67 on January 11, has caused a major change in the health of the market. This drop in leverage, together with the rise in open interest, shows a healthier positioning dynamic with less chance of cascade liquidations that have hurt earlier rallies. The fact that leverage is becoming more normal means that the present accumulation phase is being done with more care and for a longer period of time.
The way the latest rise happened gives me more confidence. The spot cumulative volume delta has gone up a lot, faster than the futures CVD. This means that there is real net purchasing going on in the spot market, not just moves caused by speculative leverage. This kind of demand, which is led by spot prices, usually leads to longer-lasting price increases since it shows that people are actually putting their money to work instead of just borrowing it to take a position.
The long-to-short accounts ratio, which is maintaining constant near 2.66, shows a bullish bias without any symptoms of too much excitement or aggressive market entry that usually happens before corrections. This restrained confidence among traders fits with the bigger technical picture, which suggests that Ethereum is developing a base for long-term growth instead of a short-term rise.
Institutional Confidence Builds Through Strategic Staking
On-chain data backs up the bullish thesis with real actions taken by institutions. BitMine’s recent staking activity shows that they are becoming more confident in the long term. On Monday alone, the company added 110,000 ETH worth $340 million. With this, BitMine’s total staking for the past three weeks is almost $3.7 billion. At the current 2.8% yield, the company could make almost $95 million a year. These big commitments show that institutional investors think the current prices are good for hanging onto for a long time.
Traditional Markets May Be Leading the Way
There is an interesting connection between the Russell 2000 index and the price of Ethereum. Because Bitcoin CEO Max pointed out that the Russell 2000 has traditionally led ETH into price discovery phases. The index has reached a new all-time high of 2,664. This sets a good example for Ethereum’s growth in the next few weeks.
ETH/USD Technical Analysis Points to Triangle Breakout
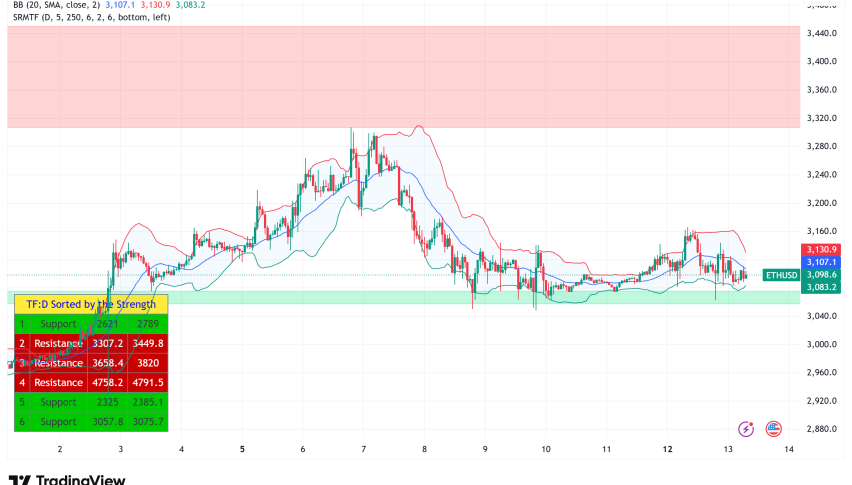
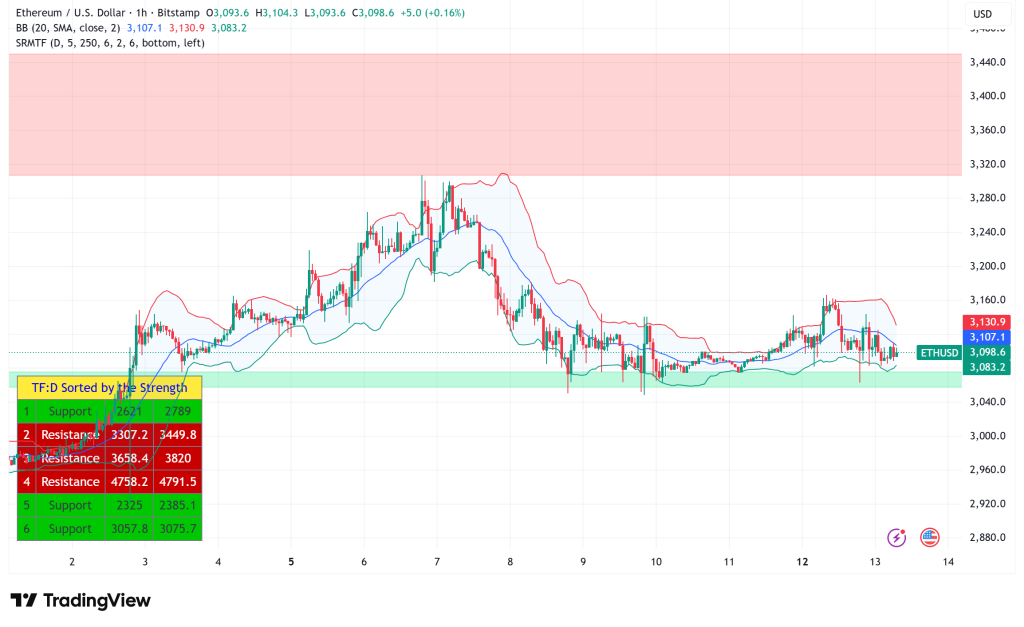
From a purely technical point of view, Ethereum seems to be testing the 20-day exponential moving average at $3,088, with bulls trying to take control following a period of consolidation. A symmetrical triangular pattern has formed, which gives us a clear idea of what the next big move will be. If the price closes over the resistance trendline, it would be a clear win for buyers. This may start a rally toward $3,569, with $4,000 being the most important psychological and technical level after that.
Different technical analysts have different ideas on how big the possible gains will be. Near-term conservative forecasts put the price between $3,400 and $3,500 by mid-January. This is backed up by Ethereum’s position within Bollinger Bands, which shows a %B reading of 0.71, meaning that the asset is trading in the upper part of its recent range without going overbought.
Ethereum Price Prediction: Long-Term Patterns Suggest Multi-Year Breakout Potential
More ambitious technical analysis suggests that a huge ascending triangle has been forming since 2020, and the current consolidation is the last step before it is finished. One TradingView analyst says that if Ethereum breaks out of this pattern that has been going on for years, it might go up to $24,000, which is almost 300% more than its current value. For this prediction to come true, Ethereum needs to keep its structural support above $1,000 and break out of the triangular pattern to the upside.
The Rainbow Chart value model, which shows Ethereum in color-coded zones that represent market psychology, currently puts ETH in the “Still Cheap” to “Accumulate” bands. The model says that a plausible appreciation range for January 31, 2026, is between $3,650 and $5,250. However, if things go very good, the price might go up to $11,000 to $15,000.
Key Risks and Downside Scenarios
There are still big risks, even when the setting is good. Ethereum is still trading below its 200-day simple moving average of $3,632, which means that the overall trend structure needs more confirmation. If the price goes back down from the resistance trendline and below the moving averages, the symmetrical triangle could last for a few more days or weeks. If the price breaks below the support line, bears would have the upper hand, and the next big level may be $2,623.
The daily average actual range of $91 shows that the market is normally volatile. However, traders should set adequate stop-losses below $3,000 to protect themselves from losses while still being open to possible gains.
- Check out our free forex signals
- Follow the top economic events on FX Leaders economic calendar
- Trade better, discover more Forex Trading Strategies
- Open a FREE Trading Account
- Read our latest reviews on: Avatrade, Exness, HFM and XM