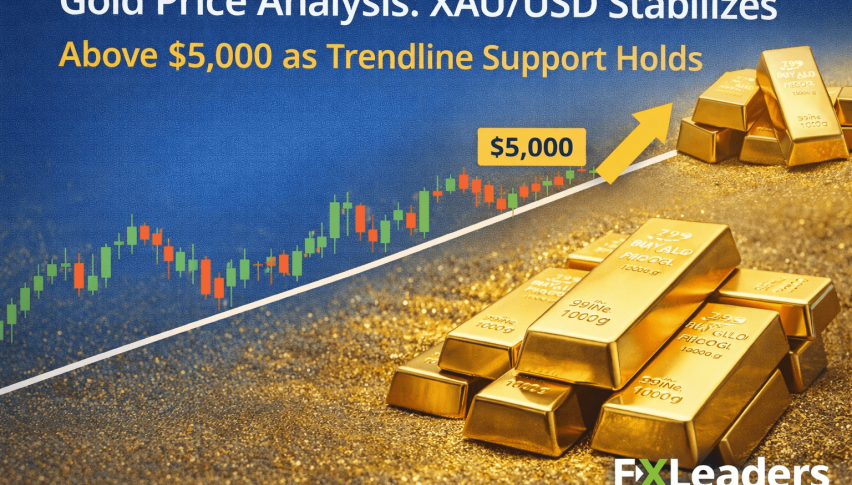
Gold Price Analysis: XAU/USD Stabilizes Above $5,000 as Trendline Support Holds
Gold prices are holding above $5,000, supported by a rising trendline from the February lows and strong demand from global central banks.
Quick overview
- Gold prices are currently above $5,000, buoyed by strong demand from central banks and a rising trendline from February lows.
- Resistance at $5,095 poses a short-term barrier, but the overall outlook remains bullish with a long-term target of $5,331.
- Key support levels include $4,946 and $4,811, while a bullish breakout above $5,095 could lead to further gains.
- Macroeconomic factors, such as Fed policy shifts and increased central bank buying, are contributing to the rising gold prices.
Gold prices are holding above $5,000, supported by a rising trendline from the February lows and strong demand from global central banks.
Resistance at $5,095 is acting as a short-term barrier, but the overall technical outlook is still bullish, with a long-term target of $5,331.
XAU/USD Technical Outlook: The Path to $5,300
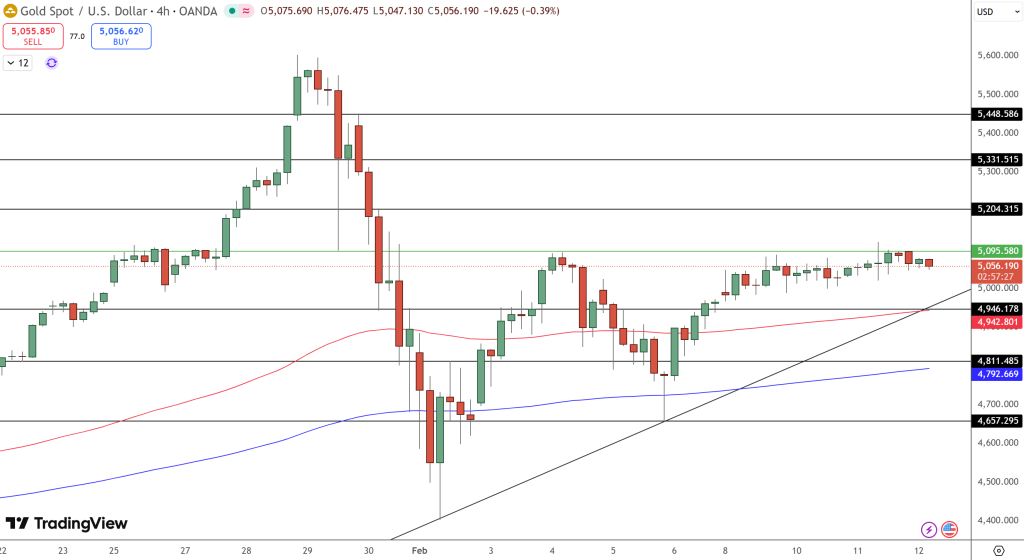
On the 4-hour chart, GOLD is in a redistribution phase. After rebounding from the early February low of $4,400, it is now trading in a short-term range between $4,946 support and $5,095 resistance.
Key Support and Resistance Levels
| Level Type | Price Point (USD) | Technical Significance |
| Major Resistance | $5,331 | Secondary extension target; 2026 high potential. |
| Immediate Resistance | $5,095 | Supply zone; 4H candle close above this triggers a rally. |
| Current Pivot | $5,056 | Median stabilization point in the current range. |
| Dynamic Support | $4,942 | Aligned with the 50-period EMA; guards the trend. |
| Trendline Support | $4,811 | Critical floor; break below invalidates the recovery. |
Moving Averages and Momentum Indicators
The Golden Cross pattern is still present, with the 200-period EMA near $4,792 continuing to move upward.
- 50-EMA ($4,942): Acts as the first line of defense for bulls.
- 200-EMA ($4,792): Confirms the broader recovery phase from the $4,400 bottom.
- Candlestick Patterns: Recent 4-hour candlesticks have small bodies and upper wicks near $5,095, which indicates some supply but not strong selling pressure.
Fundamental Drivers: Why Gold is Rising in 2026
The move above $5,000 is not only due to technical factors. Several macroeconomic factors are also driving the price higher:
- Fed Policy Shift: Weak U.S. Retail Sales (0.0% growth in Dec) have increased market bets for multiple rate cuts in 2026.
- Central Bank Buying: The People’s Bank of China has increased reserves for 15 consecutive months, providing a structural floor for prices.
- Political Risk: Speculation regarding Federal Reserve independence and tensions between the White House and Chair nominees have added a significant risk premium to the “Greenback.”
Analyst Insight: Momentum has slowed as the market consolidates. This helps prevent the market from becoming overheated and lets the 50-EMA align with the current price.
Trading Strategy: How to Trade the XAU/USD Range
Traders can focus on two main setups based on the current 4-hour price range:
- Bullish Breakout: If a 4-hour candle closes above $5,095, it signals the end of consolidation and opens the way to targets at $5,204 and $5,331.
- Buy the Dip: Consider long positions near the $4,946 support area. Use a stop-loss below $4,811 to manage risk in case the trendline does not hold.
- Check out our free forex signals
- Follow the top economic events on FX Leaders economic calendar
- Trade better, discover more Forex Trading Strategies
- Open a FREE Trading Account
- Read our latest reviews on: Avatrade, Exness, HFM and XM