Bitcoin ETFs Snap Outflow Streak with $167M Inflow as Trump’s Iran Signals Spark $70,000 Push
On Monday, March 9, 2026, the digital asset market saw a quick turnaround. U.S. spot Bitcoin ETFs brought in $167 million...

Quick overview
- On March 9, 2026, U.S. spot Bitcoin ETFs saw a $167 million inflow, reversing a two-day outflow trend of $577 million.
- Analysts attribute the rebound to the 'Trump Effect,' as easing geopolitical tensions led to a significant drop in oil prices.
- While Bitcoin gains traction, altcoin-focused ETFs continue to experience outflows, with Ether losing $225 million over three days.
- Current market metrics indicate short-term holders are selling at a loss, suggesting potential volatility before a stronger recovery.
On Monday, March 9, 2026, the digital asset market saw a quick turnaround. U.S. spot Bitcoin ETFs brought in $167 million, ending a two-day run of outflows that had pulled about $577 million from the market. This renewed interest comes as Bitcoin aims for the $70,000 mark, helped by changing global politics and falling energy prices.
Analysts say the ‘Trump Effect’ is a key reason for the rebound. After President Donald Trump suggested the U.S.-Israel-Iran conflict might ease, oil prices dropped 28%. This led investors to move money from safer commodities back into riskier assets like Bitcoin. Still, the wider ETF market shows mixed signals instead of a clear trend.
The Altcoin Exodus: Institutional Rotation or Deepening Stress?
Unlike Bitcoin, altcoin-focused ETFs are still seeing steady selling. Even though many altcoins gained 3% to 5% in the spot market, big investors are pulling their money out.
- Ether (ETH): Recorded $51 million in outflows on Monday, bringing the cumulative three-day loss to a staggering $225 million.
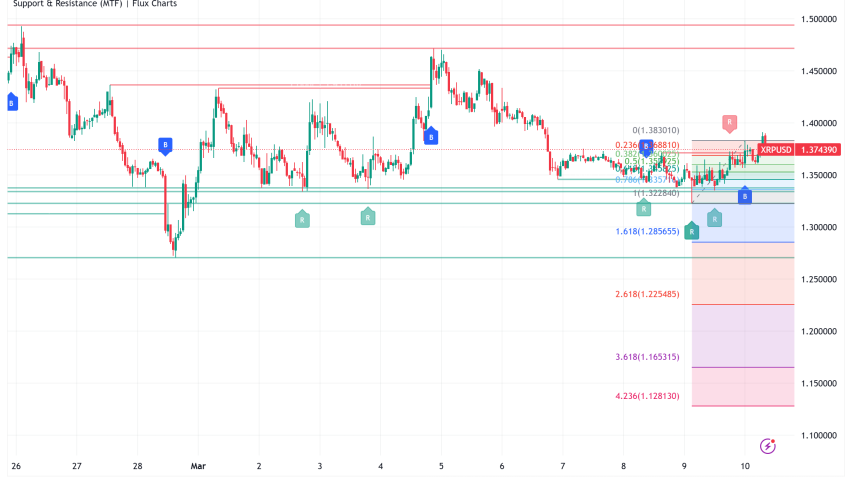
- XRP: Saw $18 million in outflows, marking a $41 million total drain since last Thursday.
- Solana (SOL): Experienced a modest $2.5 million outflow, though it has lost $16 million over the last three sessions.
This split shows that while everyday traders are buying altcoins at lower prices, big investors are moving their money into Bitcoin or leaving the market to wait for more clear rules from the upcoming CLARITY Act.
SOPR Metrics: Is the Market Building a Structural Bottom?
CryptoQuant’s on-chain data shows that even though prices are going up, the market is still under a lot of pressure. The Bitcoin Long-Term Holder to Short-Term Holder Spent Output Profit Ratio (SOPR) is now at 0.89.
| SOPR Value | Market Meaning | Current Context |
| Above 1.0 | Holders selling at a profit. | Typical of bull market euphoria. |
| At 1.0 | Breakeven point. | Pivot level for trend changes. |
| Below 1.0 | Holders selling at a loss. | Current Status (0.89): Indicates “panic” selling or capitulation by short-term holders. |
A SOPR reading of 0.89 usually means short-term traders are selling at a loss. Many analysts see this as a sign that weaker investors are leaving, which can help set up a stronger market bottom. However, since the reading hasn’t dropped below 0.80, there could still be one more round of volatility before a real recovery starts.
Bitcoin (BTC/USD) Technical Verdict: The $70,000 Gravity Well
Technically, Bitcoin is stuck near its all-time highs. The $167 million ETF inflow is helping to balance out selling from short-term holders.
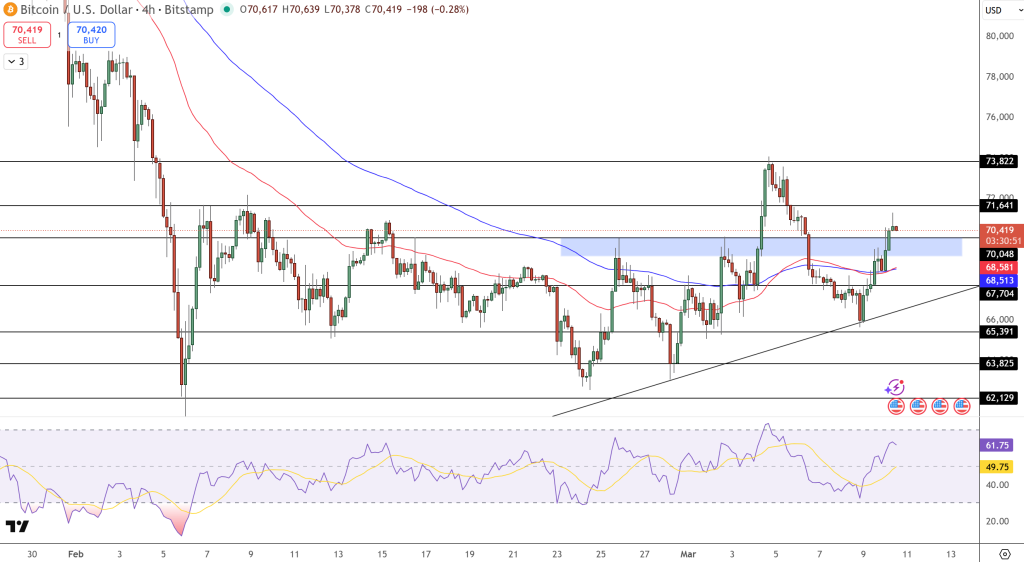
- Support Zone: The $64,500 to $66,000 range has become a strong base for institutional investors.
- Resistance Barrier: If Bitcoin closes above $71,200 for the day, it could cause a big short squeeze and push the price toward $75,000 by the end of March.
- Risk Factor: If tensions in the Middle East rise again and oil goes back above $95, the current positive mood in the market could disappear just as quickly.
- Check out our free forex signals
- Follow the top economic events on FX Leaders economic calendar
- Trade better, discover more Forex Trading Strategies
- Open a FREE Trading Account
- Read our latest reviews on: Avatrade, Exness, HFM and XM
Related Articles

Sidebar rates
Related Posts
