Bitcoin Holds $69,000: Gold ETF Exodus and Historic Oil Surge Converge Toward a $79,200 March Target
On Tuesday, Bitcoin is trading above $69,000, continuing a 4.1% intraday increase as two significant macro forces—a generational spike in
Quick overview
- Bitcoin is currently trading above $69,000, driven by rising oil prices and significant withdrawals from gold ETFs.
- Analysts suggest a potential price target of $79,200 for Bitcoin by the end of March, despite existing risks.
- The recent spike in oil prices has historically correlated with Bitcoin gains, with an average increase of 20% following similar oil price surges.
- While retail accumulation and ETF flows indicate growing institutional interest in Bitcoin, its performance remains closely tied to broader market conditions and geopolitical factors.
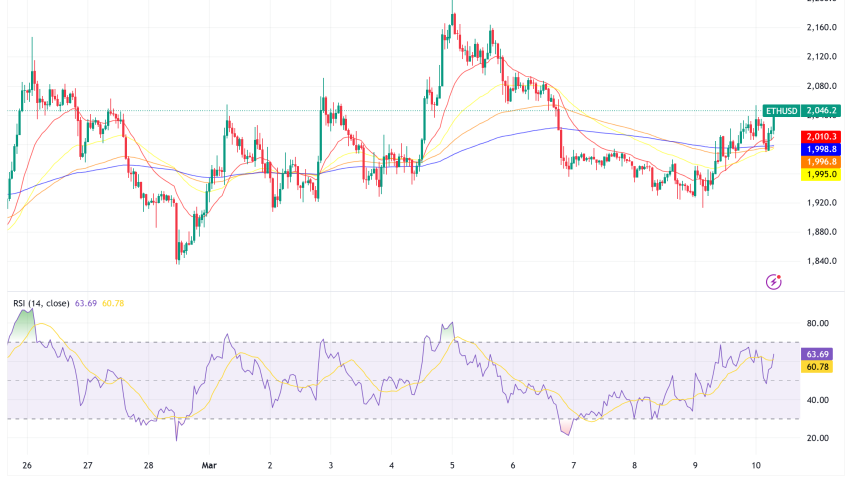
On Tuesday, Bitcoin BTC/USD is trading above $69,000, continuing a 4.1% intraday increase as two significant macro forces, a generational spike in oil prices and a historic shift out of gold ETFs, converge around the asset. Analysts and on-chain data now point to a credible path toward $79,200 before the end of March, albeit major concerns remain.
Gold’s Retreat Opens the Door for Bitcoin Inflows
Institutional investors were captivated by gold for the majority of 2025. The metal attracted billions of dollars into gold-backed exchange-traded funds (ETFs) and recorded a 65% annual return, its fourth-largest annual gain since the demise of the gold standard. In contrast, Bitcoin underwent a defensive consolidation for the majority of the previous year.
There are now early indications of a reversal in that narrative. Following a 4.4% drop in gold prices, the biggest US gold ETF, GLD, saw an astounding $3 billion withdrawal in a single day, the biggest daily withdrawal in more than two years. Zooming out, gold ETF holdings had a sharp decline in native unit terms that eliminates price distortion, from 1.4 million ounces to 621,100 ounces between February 6 and March 6.
Bitcoin ETF 30-day net flows fluctuated at that time, going from a $1.9 billion outflow on February 6 to a $273 million inflow by March 6. BTC ETF holdings in native units fluctuated by more than 46,000 BTC in terms of real accumulation, from −42,275 BTC to a net gain of 4,021 BTC.
In a December 2025 outlook, Chris Kuiper, an analyst at Fidelity Digital Assets, pointed out that historically, gold and Bitcoin have alternately outperformed. After gold’s strong 2025 run, he warned that the metal might be getting close to the end of its leadership cycle. In the past, Bitcoin has needed about 147 days following a significant bottom to begin a persistent outperformance trend. The early stages of a multi-month regime shift may be under way, as the BTC-to-gold ratio is currently close to the similar consolidation zone seen during the 2022–2023 rotation period. Lyn Alden, a macroeconomic strategist, believes that over the next two to three years, Bitcoin will beat gold.
Oil at $101 a Barrel: A Historically Bullish Signal for BTC
An amazing breakthrough in the energy markets is adding more fire to the bull case. In just ten days, WTI crude oil increased by 55% to $101 a barrel, the biggest increase in the commodity’s recorded history. The intensifying US-Israeli conflict with Iran was the primary cause of the spike, which increased geopolitical risk in international markets and caused the S&P 500 to drop to its lowest point in 10 weeks.
The initial response to Bitcoin was typical of its volatility. BTC reversed the whole 16% increase between February 28 and early March before making a comeback. That pattern, which consists of an initial spike, a reversal, and a four-week continuous rally, almost exactly matches the historical blueprint.
In the four previous cases (November 2020, February 2022, March 2023, and June 2025) where WTI oil increased 15% or more in a ten-day period, Bitcoin gained 20% on average over the next four weeks. Although the four data points are still a small sample, the incidents covered both bull and bear market conditions, giving the pattern some cross-cycle plausibility.
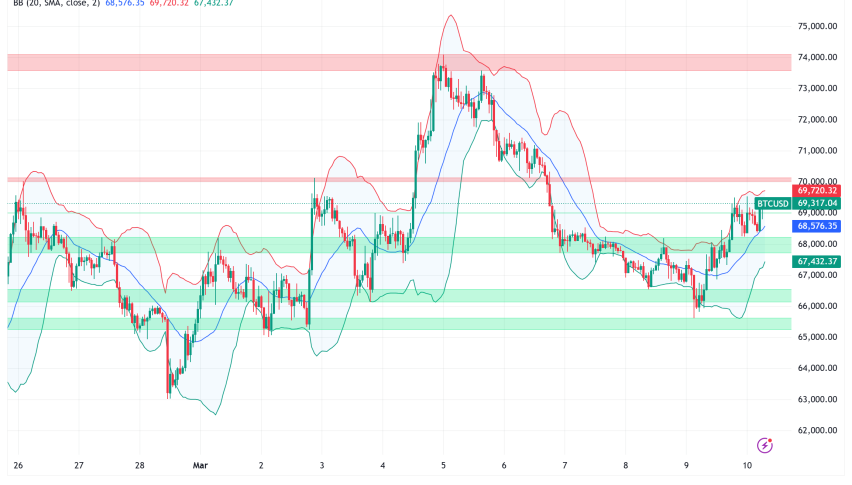
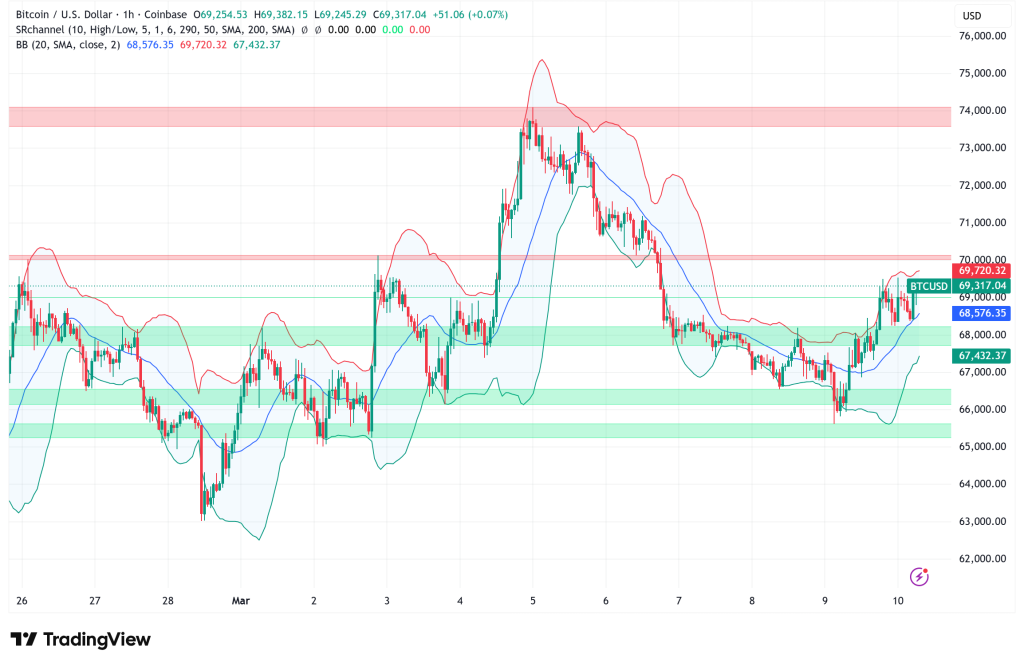
BTC/USD Technical Analysis: $79,200 in Sight, But Risks Are Real
A price estimate of $79,200 by the end of March is produced by applying the historical 20% average gain from the $66,000 level recorded when the oil rally accelerated on February 28. The setup is still in place because Bitcoin is now trading about 14% below that level, but execution is far from certain.
The important variable is Bitcoin’s current 81% correlation with the Nasdaq 100. Bitcoin’s future is intimately linked to broader risk appetite, since the tech-heavy index is still processing the effects of rising oil prices and geopolitical unpredictability. A quick recovery in stocks and the next Bitcoin surge might be triggered by a de-escalation in the Iranian crisis or reliable signals from the G7 regarding emergency oil reserve releases. On the other hand, a protracted battle with consistently high crude prices might lead to additional consumer spending weakness, inflationary pressure, and further equity selling, all of which would be detrimental to Bitcoin.
Positively, Santiment data shows that retail accumulation below $70,000 has been noteworthy, and rising ETF flows verify that institutional demand is starting to rebound. Even though the near-term path is still chaotic, the BTC-to-gold ratio strategy and Fidelity’s structural rotation thesis offer a longer-term tailwind.
Bulls in Bitcoin have a clear narrative: ETF flows are subtly shifting, oil shocks typically precede BTC rises, and gold is passing the torch. Bears highlight the asset’s close ties to tech equities, war risk, and economic fragility. Which argument is likely to prevail over the next three weeks.
- Check out our free forex signals
- Follow the top economic events on FX Leaders economic calendar
- Trade better, discover more Forex Trading Strategies
- Open a FREE Trading Account
- Read our latest reviews on: Avatrade, Exness, HFM and XM