Bitcoin Drops 4% to $71K as Iran War and Hot Inflation Data Trigger Risk-Off Cascade
As a perfect storm of macroeconomic headwinds reduced risk appetite in international markets, Bitcoin staged a dramatic reversal from its
Quick overview
- Bitcoin experienced a significant drop from its six-week high of $76,000, consolidating just above $71,000 due to macroeconomic factors rather than coin-specific issues.
- The US Producer Price Index report indicated rising inflation, leading to concerns about the Federal Reserve's ability to ease monetary policy, which contributed to a broad market selloff.
- Over $151 million in leveraged long Bitcoin futures positions were liquidated in a single day, highlighting the mechanical nature of the price decline.
- Despite the recent pressure, ongoing institutional demand through spot Bitcoin ETF inflows suggests a strong structural bull argument for Bitcoin in the medium term.
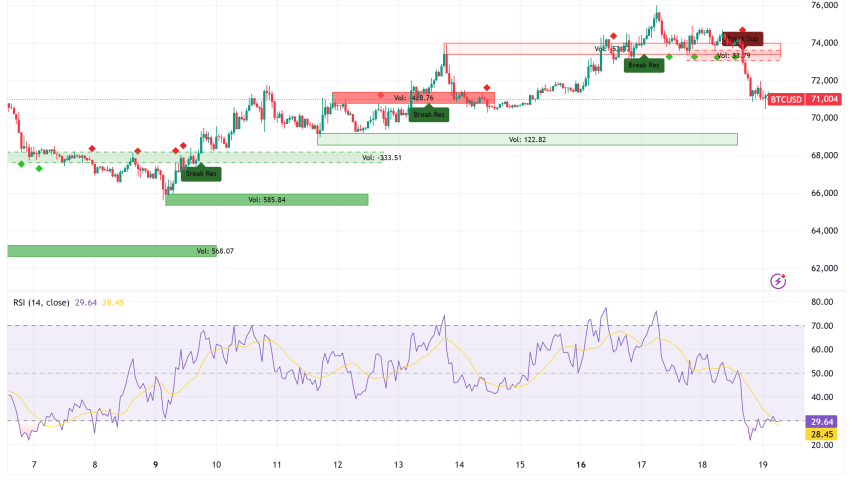
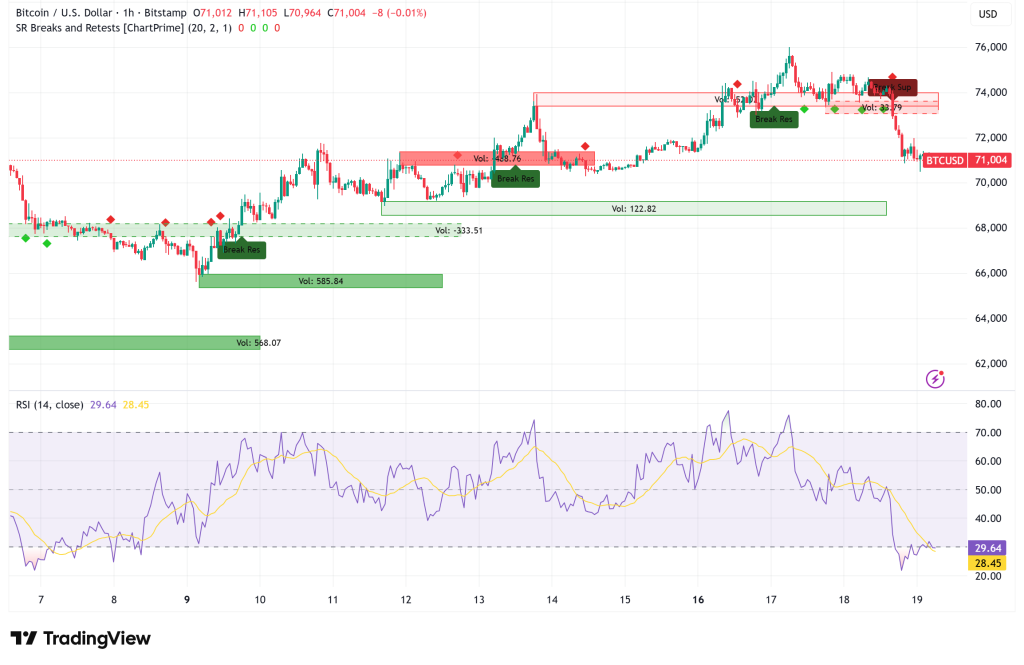
As a perfect storm of macroeconomic headwinds reduced risk appetite in international markets, Bitcoin BTC/USD staged a dramatic reversal from its six-week high of $76,000, dropping back to consolidate just over $71,000. The selloff was a macro event rather than a coin-specific one, and Bitcoin was caught in the crossfire.
Sticky Inflation and Fed Caution Spark Broad Risk-Off Selling
The US Producer Price Index (PPI) report for February, which showed wholesale prices rising 3.4% year over year—the biggest annual gain in 12 months—with a monthly increase of 0.7%, double the consensus estimate, served as the proximate cause. The results reinforced concerns that the Federal Reserve will not be able to relax policy anytime soon, especially in light of the fact that oil prices surged beyond $98 per barrel after Israeli raids on Iran’s largest gas processing plant.
On Wednesday, the FOMC appropriately kept the Federal Funds Rate between 3.5 and 3.75%, indicating that cuts are unlikely to occur in 2026. The dual-mandate tension was openly acknowledged by Fed Chair Jerome Powell: inflation is still “somewhat elevated” while the labor market appears to be deteriorating, with unemployment claims continuing to hover around 1.85 million. He pointed out that the Middle East conflict adds further uncertainty to the inflation forecast through energy costs.
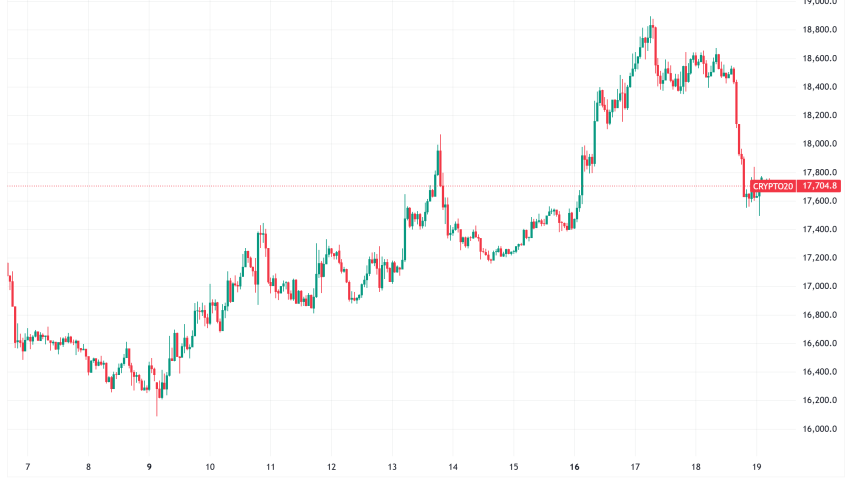
Rate-cut expectations were promptly repriced by markets. The CME FedWatch odds for a stable rate by September fell from 89% to 42% in only one month. Gold, cryptocurrency, and stocks were all sold off at the same time. This was a rates-sensitive, macro-driven move rather than a breakdown unique to cryptocurrencies, as evidenced by Bitcoin’s 89% connection with the S&P 500 and 95% correlation with gold at this time. The S&P 500 is still only 4% below its peak, indicating that the selloff is a recalibration rather than a structural break. The same reasoning probably holds true for Bitcoin. $151 million in leveraged longs were liquidated as Cascade intensified the decline.
$151 Million in Leveraged Longs Liquidated as Cascade Amplifies the Drop
In a single day, almost $151.25 million worth of Bitcoin futures positions—92% of which were long bets—were forced liquidated. The cascade effect is mechanical: as prices decline, stop-losses are triggered, which lead to additional sell orders and further declines in prices.
But context is important. Less than 1% of the $49 billion total open interest is represented by the $450 million in leveraged long futures that are at danger down to $68,000, according to CoinGlass data. Importantly, even though BTC was trading above $76,000 at its most recent top, short sellers were paying a premium to hold onto their positions because the Bitcoin permanent futures funding rate had already gone negative prior to this decline. That is the hallmark of a spot-driven rally rather than a speculative one driven by leverage. Although it hurts in the short run, the market’s foundations are far healthier after the over-leveraged optimism is purged.
On-Chain Warning: Exchange Inflows and the $75K Realized Price Ceiling
On-chain data has been flashing a warning signal before to the macro shock. Large deposits accounted for more than 60% of the hourly Bitcoin inflows to centralized exchanges on March 16, which reached 6,100 BTC, the largest single-hour reading since February 20. In the past, selling pressure has been preceded by large-scale transfers to exchanges, and this matched nearly exactly with Bitcoin’s unsuccessful attempts to hold over $75,000.
It is no coincidence that the level is $75,000. It is located in the lower range of what analysts refer to as the “traders’ on-chain Realized Price”—the average cost basis of active market players. This band has traditionally served as a ceiling during bear markets, according to Julio Moreno, head of research at CryptoQuant. Within a single 24-hour period, Bitcoin tested $75,000 three times on Coinbase, each time being refused. The complete Realized Price is currently close to $84,700, which served as resistance in January 2026 and October 2025. Reaching $84,700 would be a completely different task; clearing $75,000 would be a significant step.
The immediate battleground is currently lower. Between $70,250 and $71,275, which offered internal liquidity during Monday’s breakout, Bitcoin is challenging crucial support. In addition to confirming negative momentum, a daily close below $70,250 would pave the way for a flush toward the next significant liquidity pocket, which is located around $68,900. A $72,800 recovery on the upside would indicate that bulls had taken back control of the near-term structure.
ETF Inflows, Strategy Buying, and the Gold-Rotation Thesis Keep Bulls Alive
The structural bull argument for Bitcoin is still strong in spite of the pressure. Spot Bitcoin ETF inflows have now increased for seven days in a row, indicating ongoing institutional buildup that has created a demand floor beneath each decline. Strategy (MSTR) has persisted in making aggressive purchases of Bitcoin, supporting the concept that speculative derivatives activity is driven by the spot market.
The Federal Reserve has entered a “gradual print” phase, according to macroeconomist Lyn Alden, in which fresh money is continuously issued, creating a slow-burning tailwind for hard assets. After hovering above $4,800 for four weeks, gold began to show signs of weariness on Wednesday, falling to $4,900. A rotation from gold to Bitcoin becomes more likely over the medium term if inflation worries continue to reduce real returns on fixed-income assets. The 2-year Treasury yield is currently at 3.71% against a 2.27% inflation expectation, yielding an adjusted return of 1.44% that is still far from panic territory.
Arthur Hayes, a co-founder of BitMEX, has stated that he is waiting for the Fed to lower interest rates before starting to buy Bitcoin again. However, he also points out that monetary expansion has historically been driven by war financing, a macro setup that, if it comes to pass, would be a strong tailwind for Bitcoin regardless of short-term volatility.
- Check out our free forex signals
- Follow the top economic events on FX Leaders economic calendar
- Trade better, discover more Forex Trading Strategies
- Open a FREE Trading Account
- Read our latest reviews on: Avatrade, Exness, HFM and XM
Related Articles
Sidebar rates
Related Posts
