Bitcoin Holds $66K Amid Bear Flags and Macro Storm, But $52,500 Looms If Support Cracks
Bitcoin is currently trading at about $66,375, which hasn't altered much in the last day. However, a worrying technical structure develops
Quick overview
- Bitcoin is currently trading at approximately $66,375, showing little change but forming a concerning bear flag pattern on the daily chart.
- Analysts warn that a sustained close above $76,000 is necessary to invalidate the bearish pattern, while a breakdown could target $52,500.
- Institutional selling pressure is increasing, with significant withdrawals from Bitcoin ETFs and notable sales by companies like Riot Platforms and MARA Holdings.
- Bitcoin is expected to remain range-bound between $60,000 and $73,000 until a significant market catalyst emerges.
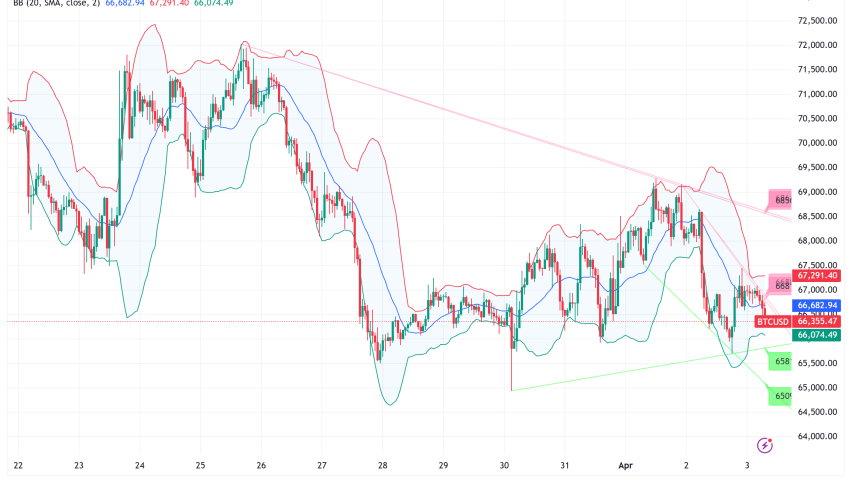
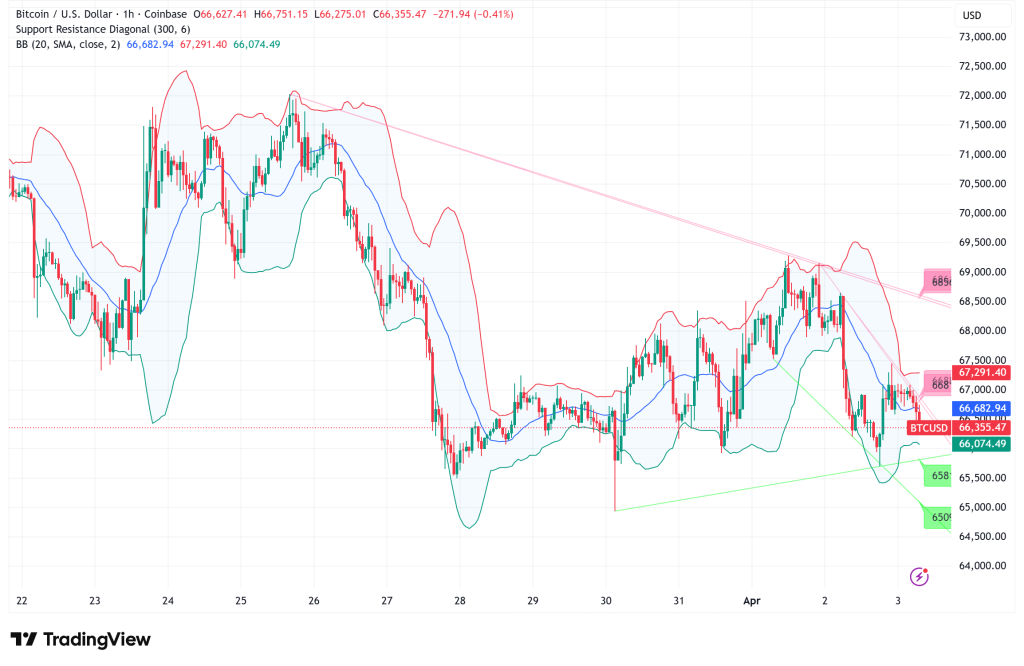
Bitcoin BTC/USD is currently trading at about $66,375, which hasn’t altered much in the last day. However, a worrying technical structure is developing behind the quiet surface. BTC has printed a confirmed bear flag pattern on the daily chart, and a second flag is currently in action. Since February 8, every attempt to rally toward the flag’s above trendline has been unsuccessful, and analysts caution that the pattern must be invalidated by a prolonged multi-day close over $76,000.
Bear Flags and Broken Rallies: The Technical Picture Is Troubling
Aksel Kibar, a chartered market expert, has set a downside objective of $52,500, subject to a breakdown below the lower border of the pattern. This worry is supported by Hyblock’s liquidation heatmap data, which shows a dense cluster of leveraged long positions between $63,000 and $65,000. If those holdings are eliminated, a liquidity gap widens all the way down to the $56,000–$57,500 zone. The fact that aggregate open interest is still below $20 billion, a level not seen since early February when Bitcoin was trading close to $79,000, indicates that trader conviction is noticeably lacking on the upside.
Macro Headwinds Are Piling Up Fast
Bitcoin is not benefiting from the macroenvironment. The S&P 500 has lost 3.95% so far this year, WTI momentarily jumped beyond $110 after President Trump’s address on Iran, and Brent crude has risen to levels not seen since 2008. The market’s appetite for risk is being squeezed on several fronts at once.
The US Treasury Department has expressed concerns about the $2 trillion private lending sector, adding to the strain. With a 5% withdrawal cap, alternative asset manager Blue Owl, which manages $307 billion, received unusual redemption demands on two of its private credit funds. In the meantime, US continuing unemployment claims increased to 1.84 million for the week ending March 21, indicating a weakening labor market as businesses shift spending into artificial intelligence at the expense of human resources.
Institutional Selling Adds Near-Term Pressure
Data from ETFs and on-chain shows that institutional demand is declining. Since March 24, there had been $450 million in net withdrawals from US-listed spot Bitcoin ETFs. In March, Riot Platforms moved 500 BTC for sale, MARA Holdings sold 15,133 BTC below its expected cost basis, and Nakamoto Holdings offloaded 284 BTC, reversing its previously announced accumulation strategy.
The bright side is that companies like Strategy (MSTR) and Metaplanet are still withstanding sell-side pressure, and ETF withdrawals are anticipated to decrease if Bitcoin maintains its $66,000 level.
Bitcoin Price Prediction: Downside Risk and Range-Bound
Support Levels
- $66,000: immediate
- $60,000: key floor
- $56,000–$57,500: next major zone
Resistance Levels
- $70,000: near-term ceiling
- $76,000: bear flag invalidation
- $79,000+
Bitcoin is likely to be range-bound between $60,000 and $73,000 until a clear catalyst appears, such as a Fed liquidity turn prompted by the anticipated $1.9 trillion US deficit, a de-escalation in the Middle East, or fresh institutional inflows. The technical view would become optimistic if a close over $76,000 was maintained for two or three days in a row. However, Kibar’s $52,500 aim becomes accessible if $60,000 is not held.
- Check out our free forex signals
- Follow the top economic events on FX Leaders economic calendar
- Trade better, discover more Forex Trading Strategies
- Open a FREE Trading Account
- Read our latest reviews on: Avatrade, Exness, HFM and XM
Related Articles
Sidebar rates
Related Posts
