Ethereum Flashes Rare Capitulation Signal: Why a Move to $2,500 Is Now on the Table
After overcoming resistance at $2,150 with a 6.33% rise, Ethereum is stabilizing above that level. The rise has put ETH in a position to
Quick overview
- Ethereum has stabilized above $2,150 after a 6.33% rise, positioning it to retest its March peak at $2,385.
- The current market structure shows strong spot demand, with futures traders following the trend rather than leading it.
- The Capriole Macro Index Oscillator indicates a rare undervaluation for Ethereum, suggesting a potential trend reversal.
- While the path to $2,500 appears open, confirmation through a decisive closure above $2,400 is necessary for a trend reversal.
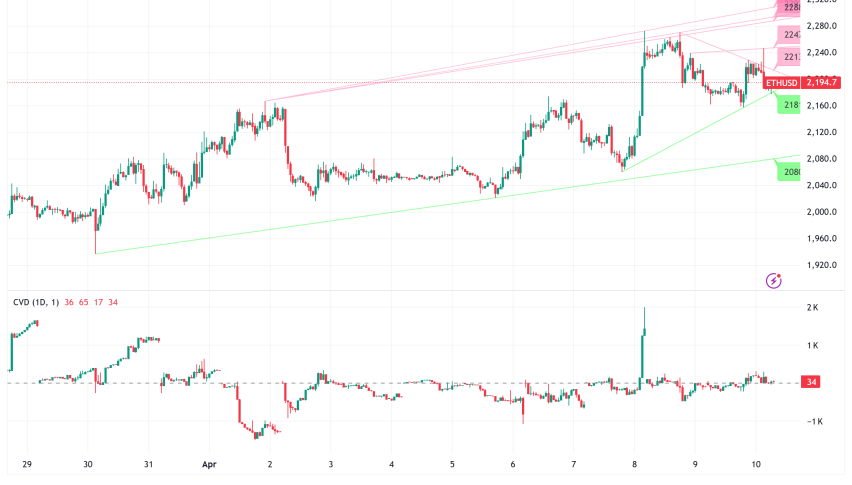
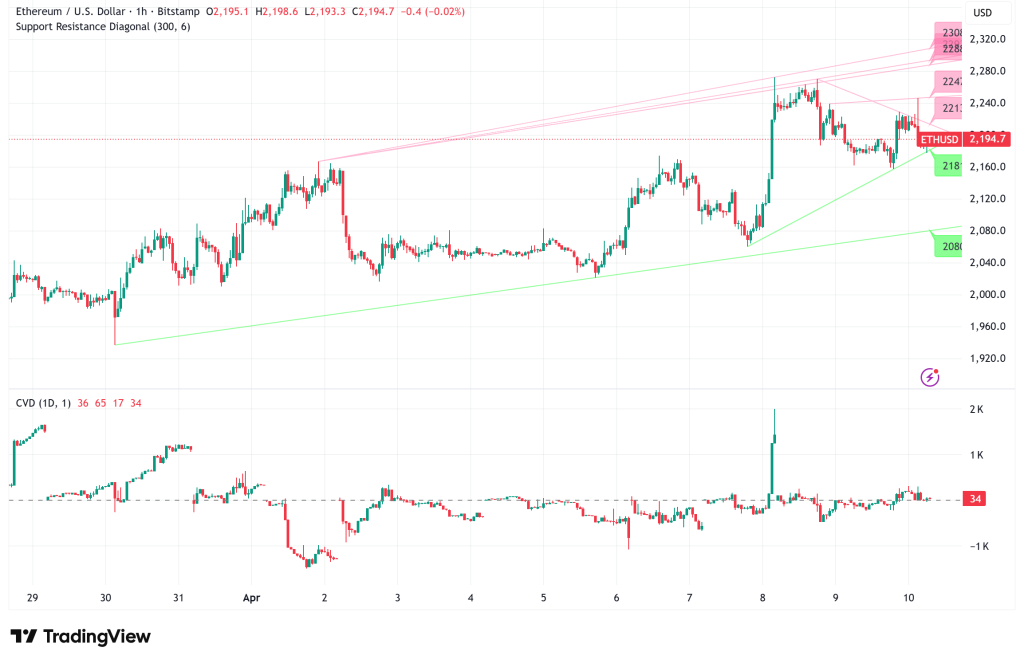
After overcoming resistance at $2,150 with a 6.33% rise, Ethereum ETH/USD is stabilizing above that level. The rise has put ETH in a position to retest its March peak at $2,385 on the daily chart. A more expansive objective is located in the $2,475–$2,635 fair-value gap, which has historically attracted buyers.
It is encouraging that $2,150 has been retested several times in recent weeks. Buyers have intervened at even higher levels each time sellers have tried to push through, weakening resistance each time. While attempting to establish itself in the $2,250–$2,300 region, ETH continues to record higher lows on the four-hour period.
Spot Demand Leads, Futures Follow: A Healthier Market Structure
The buying composition is what makes the current setting especially noteworthy. Through April, the aggregated spot cumulative volume delta (CVD) remained high at 184,500 ETH; this reading indicates real, organic demand rather than the accumulation of speculative leverage. The futures CVD has risen to 4.36 million ETH, indicating that traders in derivatives are starting to take part, but they are following rather than driving the trend. With a little long bias of +0.0052, the funding rate is not overheating dangerously.
Leverage hasn’t been forcefully reintroduced since February’s flush, as evidenced by the range-bound open interest near 4.75 million ETH. This is how an on-chain controlled accumulation phase appears: spot-driven, with futures support progressively developing beneath. It would probably be necessary for open interest to significantly increase from current levels for a more clear breakout toward $2,500—a signal worth keeping an eye on.
The $2.1 Billion Leverage Flush That Wasn’t a Breakdown
What took place in February is one of the most crucial contexts for the current upsurge. Midway through February 2026, Binance’s ETH open interest showed a 30-day change of roughly -$2.13 billion, the most significant deleveraging since October 2025, when a similar -$2.11 billion reading took place. The scale of forced exits appeared to be proof of more declines at the time, and the chart was declining. However, the price remained above $1,800 and did not plummet. In this case, the mechanism is important since a fast decline in open interest without a corresponding reduction in price indicates that the leverage being removed was speculative excess rather than actual demand.
The market was cleaned of positions that would have increased additional selling due to the forced liquidations. Holders with sufficient conviction to absorb the exits without recoiling were what were left. The October 2025 analogy is instructive; instead of extending lower, a similar flush at that time was followed by stabilization and recovery. The same result was obtained in February 2026. As a direct result of the improved fundamental base, ETH is currently trading above $2,200. Nevertheless, ETH continues to trade below its 50-day, 100-day, and 200-day moving averages, all of which are now declining.
The 50-day average has not yet been convincingly regained by the bounce toward $2,200, and decreasing volume during consolidation points to less participation rather than renewed aggressive demand. The structure is creating a foundation, but recovering the $2,400–$2,600 area where the 100-day average is located is necessary to prove a reversal.
The Macro Signal: A Rare Undervaluation Reading Not Seen Since 2022
The Capriole Macro Index Oscillator, which is currently at -2.42, is arguably the most dramatic piece of evidence in favor of the bull case. This reading puts Ethereum in a region that has traditionally been linked to trend reversal and capitulation; a level this negative has not been observed before 2022. The oscillator monitors cycle positioning, investment behavior, and on-chain data; traditionally, seller weariness has been indicated by extremely negative readings.
The track record is consistent: in June–July 2022, ETH bottomed near $1,000–$1,200 when the reading fell to -2.2; in October–November 2023, a drop to -1 aligned with a breakout from $1,500; and in April 2025, a negative reading marked a local bottom near $1,500 before a rally above $4,000. The current configuration is similar to those earlier stages of capitulation. While the oscillator is close to cycle lows, ETH has dropped from highs of almost $4,800 to about $2,100. When combined with the present decline depth, the structure mimics the pre-rally setting of April–May 2025. The analyst statistic that tracks the ETH taker buy/sell ratio likewise exhibits an increasing trend over four to five months.
Ethereum Price Prediction: Path to $2,500 Is Open, But Confirmation Needed
The macro and technical data support a cautiously optimistic view. The $2,000 level has frequently served as a floor, and the leverage overhang from the cycle peak has mostly cleared, suggesting that the downside is structurally constrained. In the past, the Macro Oscillator has not remained at -2.42 without a significant price rebound. The path to $2,500 is visible: a reclaim of the $2,250–$2,300 range on the four-hour chart, followed by a push through the March high near $2,385, would set up a test of the $2,475–$2,635 fair-value gap — the next meaningful area where sellers are likely to re-engage.
Bulls, however, require verification. The structure would change from a recovery attempt to a trend reversal with a decisive closure above $2,400, regaining the 100-day moving average. Up until then, the picture is positive but unfinished: accumulation is happening, a base is being established, and leverage has been removed, but it hasn’t been verified as a fresh upswing. If $2,000 gives way, there is still risk to the downside. This would refute the accumulation thesis and allow for a retest of lower support levels.
- Check out our free forex signals
- Follow the top economic events on FX Leaders economic calendar
- Trade better, discover more Forex Trading Strategies
- Open a FREE Trading Account
- Read our latest reviews on: Avatrade, Exness, HFM and XM
Related Articles
Sidebar rates
Related Posts
