Descending Triangle – GBPJPY Eyeing the Breakout!
What’s up, traders. Hope you enjoyed our forex trading signal mentioned in Triple Bottom Pattern In GBPJPY - Get Ready To Jump In. Now, t
What’s up, traders. Hope you enjoyed our forex trading signal mentioned in Triple Bottom Pattern In GBPJPY – Get Ready To Jump In. Now, the GBPJPY is cooking up another trade setup which is worth trading.
GBPJPY – Triangle Pattern
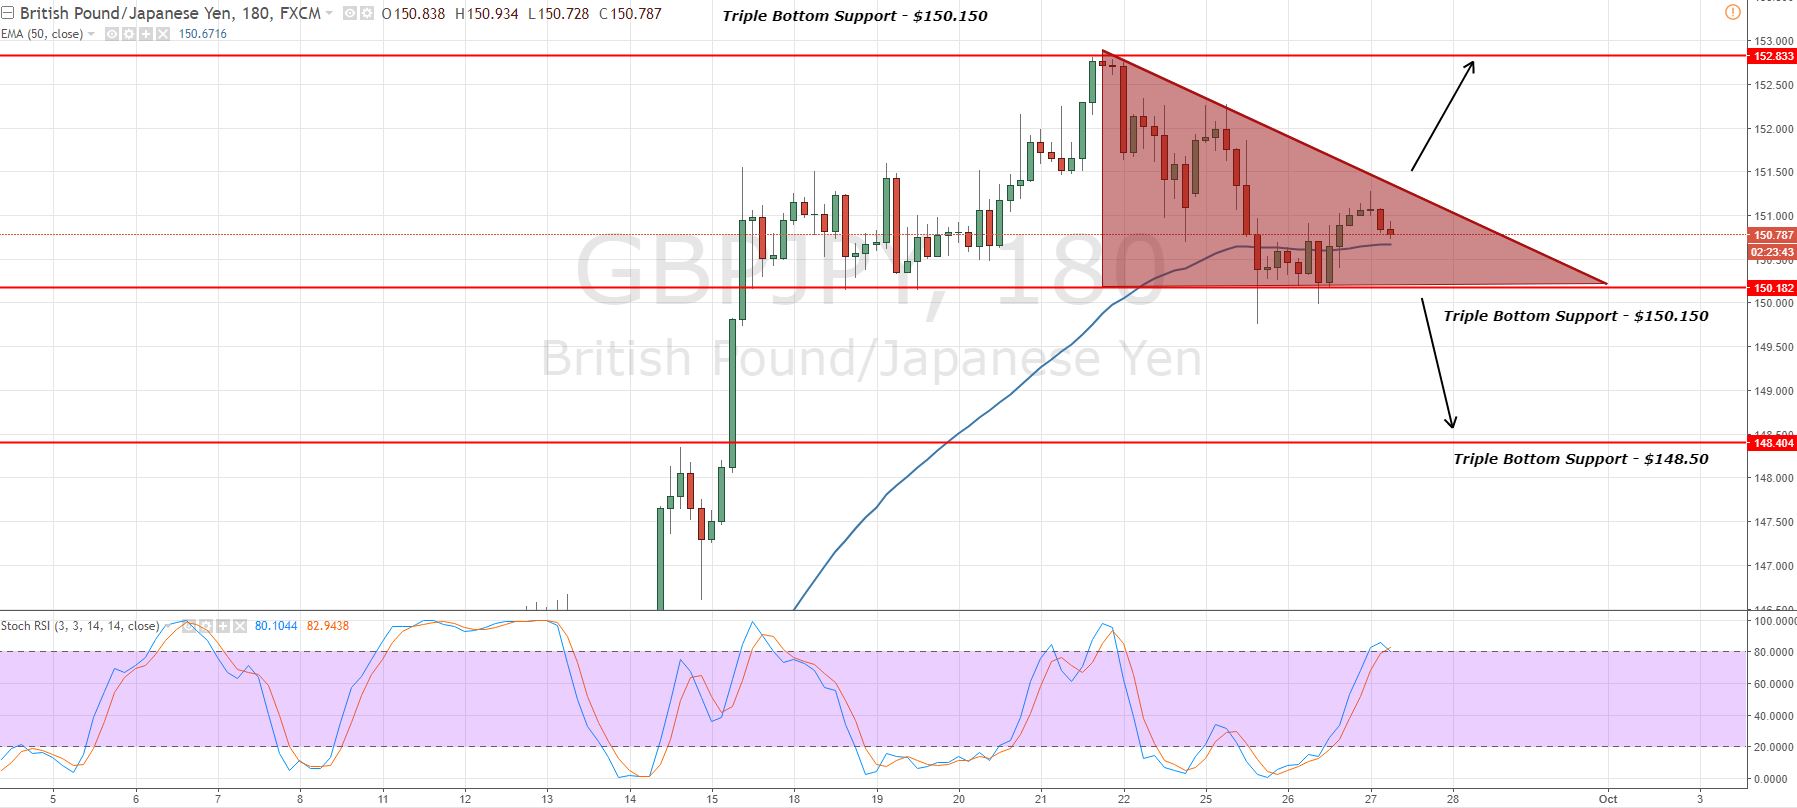
The Guppy is trading neutral tossing in a sideways range of $150.150 – $151.100. Due to this neutral behavior, the GBPJPY has formed a descending triangle pattern which can be seen on the 3-hour timeframe.
This triangle pattern is making me cautious about the next trade in it. Surely, we can try to scalp the pair by capturing quick 20-30 pips by selling and buying within the triangle, but the risk to reward ratio will be crappy. Thus, it's better to trade the breakout as in this way we can make some serious pips.
 GBPJPY – Descending Triangle Pattern – 3 Hour Chart
 GBPJPY – Descending Triangle Pattern – 3 Hour Chart
As of now, the leading indicators RSI and Stochastic are stuck in the overbought zone. Let me add that, these descending triangle patterns are supposed to break downward. On the breakage of $151.150, the market can tick down towards $148.50 this week.
GBPJPY – Trading Plan
At the moment, I'm looking to stay in selling below $151.350 in order to target $150.20 and will prefer to enter a buying at $150.150 with a small stop loss of $149.850. Good luck and keep following for more updates!
- Check out our free forex signals
- Follow the top economic events on FX Leaders economic calendar
- Trade better, discover more Forex Trading Strategies
- Open a FREE Trading Account
- Read our latest reviews on: Avatrade, Exness, HFM and XM
Related Articles


Sidebar rates
Related Posts
