The Downtrend Remains Strong in USD/CAD
USD/CAD retraced higher today, but the retrace seems to be over at the 50 SMA
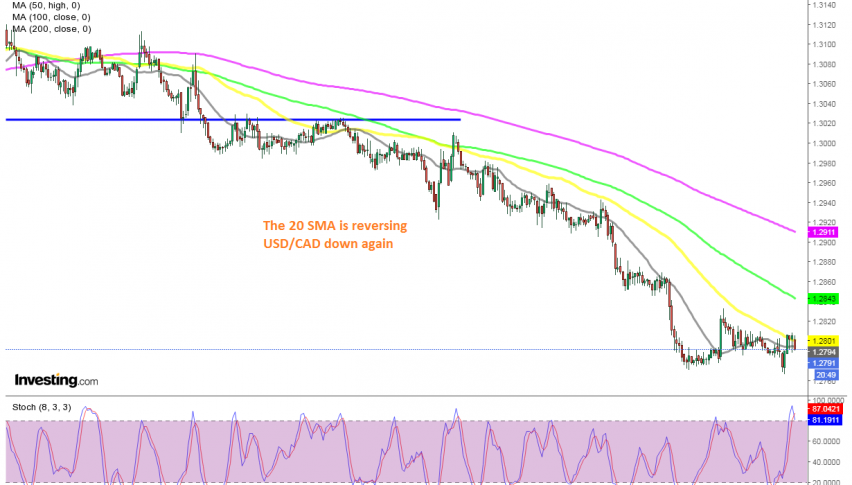
The Canadian Dollar has been bullish for many months, helped by the increase in crude Oil prices since the middle of April, when WTI crude reversed from $ -40. The downtrend has been really strong, with moving averages providing resistance in all time-frames.
In the first day of September, USD/CAD pierced the 1.30 level, but retraced higher until the end of October, when it resumed the bearish trend again. The big round level at 1.30 was finally broken for good in the beginning of November and the bearish momentum picked up pace since then.
The downtrend has been particularly strong in the last few weeks, as the USD turned even weaker after EUR/USD broke above 1.20. We have opened a few sell forex signals in this pair in recent weeks, which have closed in profit. Yesterday i sold this pair after the retrace higher and the trade closed in profit overnight after the reversal back down.
Today, we are seeing another pullback higher, but the retrace seems to be complete at the 50 SMA (yellow) on the H1 chart. So, we decided to open another sell forex signal in this pair, since the stochastic indicator is overbought on this time-frame chart and now it looks like the reversal down is happening.
- Check out our free forex signals
- Follow the top economic events on FX Leaders economic calendar
- Trade better, discover more Forex Trading Strategies
- Open a FREE Trading Account
- Read our latest reviews on: Avatrade, Exness, HFM and XM
Related Articles


Sidebar rates
Related Posts
