Oil Consolidating In A Range Between Two MAs Before the Breakout
Oil prices have been climbing relentlessly in the last month or so. The climb accelerated by the end of last week and the beginning of this
Oil prices have been climbing relentlessly in the last month or so. The climb accelerated by the end of last week and the beginning of this week, but in the last few days, Oil prices have been consolidating around the $57 region, give or take half a cent.
Is this a consolidation before the next breakout higher?
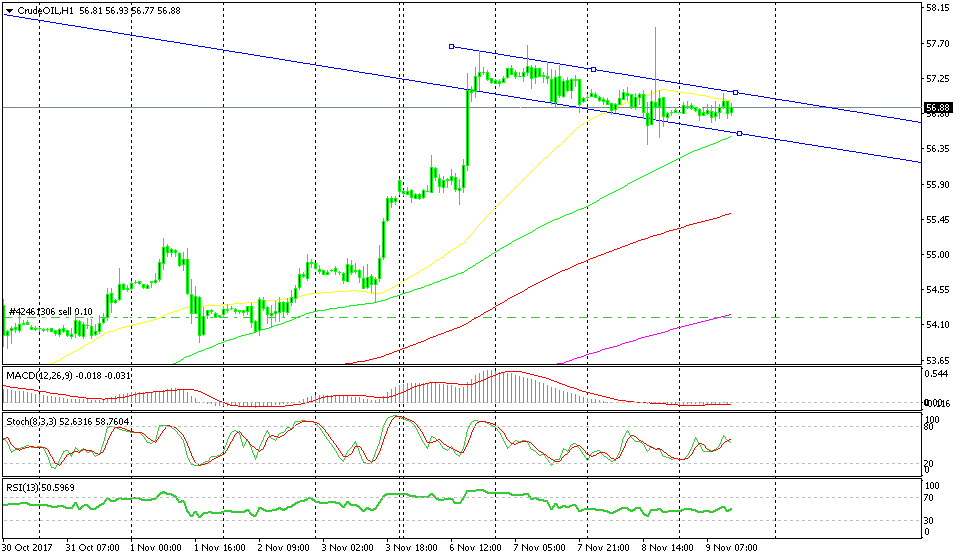
As you can see from the hourly Oil chart above, the consolidation started on Tuesday. It has formed a descending range since then and yesterday US Oil entered an area between two moving averages.
The 50 SMA (yellow) is now standing at the top providing resistance, while the 100 SMA (green) is at the bottom. The price is having difficulties breaking above the 50 SMA, but the downside doesn’t look too favorable either.
The price is moving away from the bottom line of the range and the 100 SMA is moving higher as time goes by. Soon it will reach the price and provide more support. So, this looks more like a bullish flag to me. If the bullish flag is to work as explained in forex textbooks, then the next move higher is coming up.
- Check out our free forex signals
- Follow the top economic events on FX Leaders economic calendar
- Trade better, discover more Forex Trading Strategies
- Open a FREE Trading Account
- Read our latest reviews on: Avatrade, Exness, HFM and XM
Related Articles


Sidebar rates
Related Posts
