The 100 SMA Held As Resistance for EUR/GBP
EUR/GBP was retracing higher, but the climb stopped at the 100 SMA today
The EUR/GBP was trading sideways during the second half of last year, but it turned bearish at the end of December, as the UK and the EU were heading towards reaching a trade deal. That improved the sentiment for the GBP, which has been mostly bullish since then, pushing the EUR/GBP down.
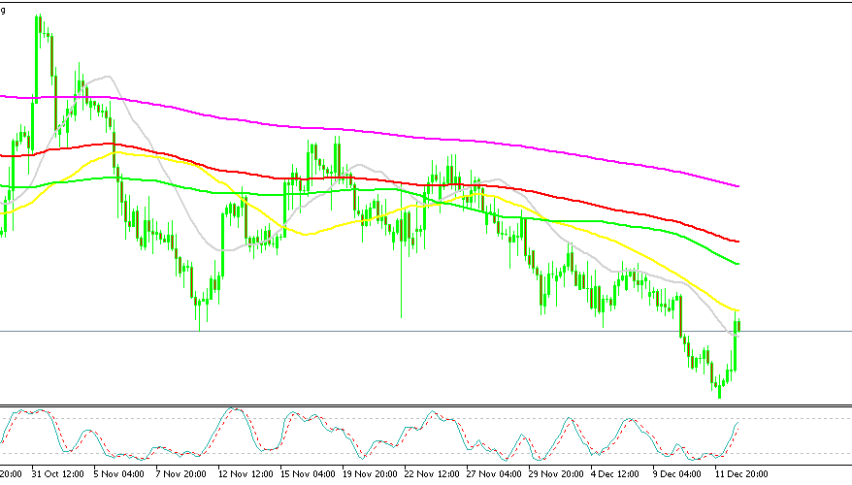
Moving averages have been doing a great job in providing resistance on retraces higher, reversing the price down and pushing the EUR/GBP lower. On the H4 chart, the 50 SMA (yellow) has been doing that job, while on the H1 chart above, we have the 200 SMA (purple) which has been providing resistance in recent weeks.
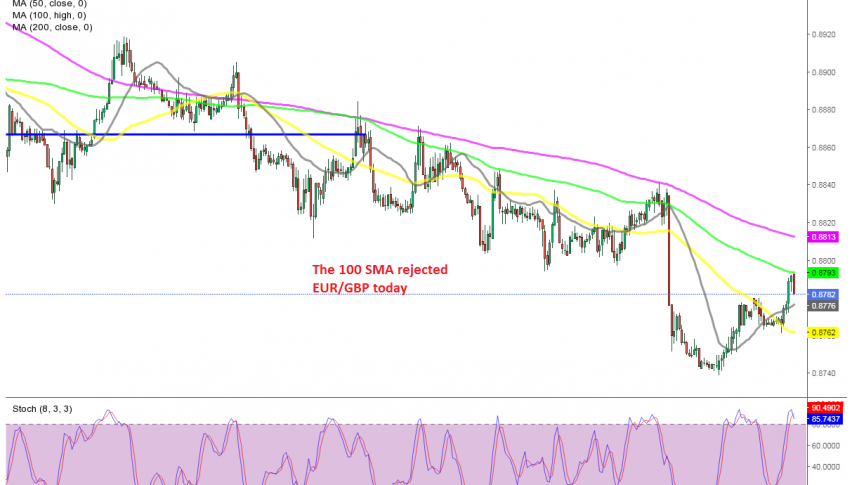
Last week we saw a 100 pip tumble lower in the EUR/GBP, after it was rejected by the 200 SMA again. The price was retreating higher towards the end of the week, after the decline, and we decided to open a sell forex signal below the 50 SMA (yellow).
But buyers pushed above that moving average as the EUR/USD turned bullish, although the 100 SMA (green) seems to have stopped its climb today, and the price has reversed down. However, it’s not exactly crashing lower, so we will see whether sellers can take control of this forex pair again. For now, our forex signal is safe, but I think that it will be better to move the stop loss a few pips above 0.88.
- Check out our free forex signals
- Follow the top economic events on FX Leaders economic calendar
- Trade better, discover more Forex Trading Strategies
- Open a FREE Trading Account
- Read our latest reviews on: Avatrade, Exness, HFM and XM
Related Articles
Sidebar rates
Related Posts
