Gone Short on AUD/USD on the Same Bearish Chart Setup
A while ago we opened a sell forex signal in AUD/USD. The chart setup was similar to the one we posted yesterday when we went short here.
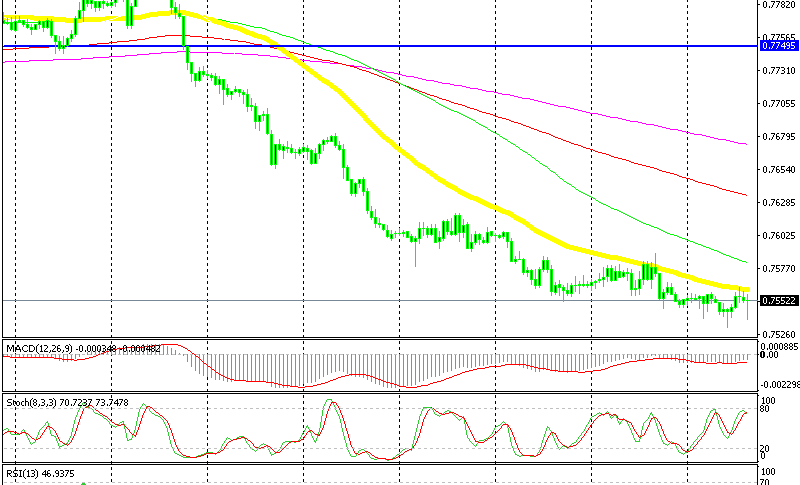
The 50 SMA is a tough nut to crack for buyers
A while ago we opened a sell forex signal in AUD/USD. The chart setup was similar to the one we posted yesterday when we went short on this pair. That signal hit take profit yesterday, so why not give it another try today if the charts are the same?
As you can see from the hourly chart below, AUD/USD has been trading on a steep downtrend for quite some time. The downtrend has lost some pace in the last few days, but the 50 SMA (yellow) is not letting go. It is providing solid resistance and it has been pushing the price lower during this time.
So, that is one of the main reasons that we went short of AUD/USD again, apart from the downtrend itself. Another indicator which is pointing down is stochastic. It is almost overbought which means that the retrace up is complete.
Although, the US GDP report is messing with the forex market at the moment. The Q1 GDP came at 2.3% against 2.0% expected and last quarter was revised higher as well, but the price index took a dive and that has left forex traders puzzled. We will explain this report on the next update though.
- Check out our free forex signals
- Follow the top economic events on FX Leaders economic calendar
- Trade better, discover more Forex Trading Strategies
- Open a FREE Trading Account
- Read our latest reviews on: Avatrade, Exness, HFM and XM
Related Articles


Sidebar rates
Related Posts
