Break Above the 200 Daily SMA for Gold or a Reverse Back Down Soon?
Gold is hesitating at the 200 daily SMA again after the bullish reversal

Gold made quite a reversal in August, after the crash at the beginning of last month. The precious metal lost around $150 in the first week of August, which came as a bit of a surprise since there was no real trigger behind that move, and no one was expecting it.

20 SMA providing solid support for Gold
But, the decline stopped suddenly, and the reversal was just as surprising after such a crash. The bullish momentum has continued since then and buyers remain in control. Moving averages have turned into support on the H4 chart, particularly the 20 SMA (gray) and the 50 SMA (yellow), which shows that the buying pressure is strong.
Although, on the daily chart GOLD is facing the 200 SMA (purple), which stands at around $1,820. This moving average was acting as resistance in July, which ended the retrace higher that month before the crash came. Now gold is having trouble pushing above this moving average again. Buyers have been testing the 200 daily SMA, but it has failed for the last three days.

200 SMA stopping gold from moving higher
Now, gold is overbought on the daily time-frame chart, as shown above, with the stochastic indicator severely overbought. This might actually be a good place to sell gold, since the USD has been weak during the last few weeks, but the weakness is abating now.
That would reverse gold lower, although markets are expecting restrictions to increase in the northern hemisphere now, as we head into the winter period. So, we are evaluating the situation and might take a trade in gold, which will be displayed in our Forex signals section. The US ADP employment posted another big miss for August, so that’s a positive factor for gold.
The second big miss
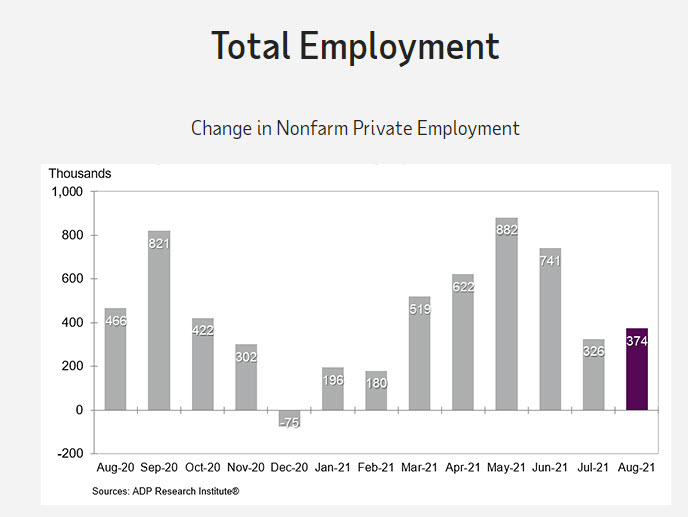
- Prior month
- Prior month revised to plus 326K from +330K. Recall from last month, the BLS estimate for job gains came in at 943K. Since the pandemic, the ADP and BLS employment data has diverged
- Small businesses saw a gain of 86K
- Midsize businesses saw a gain of 149K
- Large businesses saw a gain of 138K
- Goods producing sector increase by 45K
- Service providing sector plus 329K
- Natural resources plus 9K
- Construction +30 K
- Manufacturing plus 6K
Service producing industries saw job gains of:
- Trade transportation and utilities, +18 K
- Information, unchanged
- Financial activity +13 K
- Professional business +19 K
- Education and health care, +59K
- Leisure and hospitality, +201K
- Other services, +19 K
Comments from ADP and Moody’s analytics.
Nela Richardson, chief economist for ADP said:
- “Our data, which represents all workers on a company’s payroll, has highlighted a downshift in the labor market recovery. We have seen a decline in new hires, following significant job growth from the first half of the year. Despite the slowdown, job gains are approaching 4 million this year, yet still 7 million jobs short of pre-COVID-19 levels. Service providers continue to lead growth, although the Delta variant creates uncertainty for this sector. Job gains across company sizes grew in lockstep, with small businesses trailing a bit more than usual.”
Mark Zandi, chief economist of Moody’s Analytics, said,
- “The Delta variant of COVID-19 appears to have dented the job market recovery. Job growth remains strong, but well off the pace of recent months. Job growth remains inextricably tied to the path of the pandemic.”
- Check out our free forex signals
- Follow the top economic events on FX Leaders economic calendar
- Trade better, discover more Forex Trading Strategies
- Open a FREE Trading Account
- Read our latest reviews on: Avatrade, Exness, HFM and XM
Related Articles


Sidebar rates
Related Posts
