Ripple (XRP) and Uniswap (UNI) Analysis – Threatening the Support As Cryptos Remain Bearish
Uniswap (UNI) and Ripple (XRP) face MAs as they remain bearish today
Cryptocurrencies were quite bullish during August and the bullish momentum continued until the beginning of September. But, they went through a sudden crash last Tuesday and haven’t been able to recuperate since then, bunting up and down in a range since then, while today they turned bearish again and are threatening to break some important levels and indicators which have been acting as support for certain cryptos.
Ripple Forecast – XRP/USD Facing the 50 Daily SMA Down
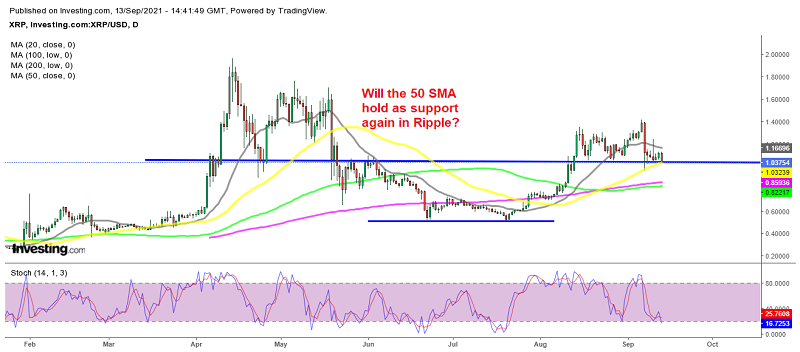
Ripple coin turned quite bullish in August, as it gained around 280% in value, after reversing from the support at $0.50 in July. It continued the bullish momentum until the first week of September, reaching $1.40s. But, profit-taking resumed and Ripple retreated lower before the crash came in the crypto market.
The price fell below $1, although the 50 SMA (yellow) held Ripple during that crash, and on Friday we saw a flash jump to $1.24. But that didn’t last long and the price came back down, suggesting that sellers were in control, as in most of the market. So, sellers have prevailed since then and today they are having another go. Now XRP/USD is facing the 50 daily SMA again and the support zone between $1 and $1.05. This is a good place to get long on Ripple coin, but was already have a Ripple buy signal open here.
Ripple Coin Live Chart
Uniswap Forecast – UNI/USD Facing the 100 SMA on the H4 Chart
Uniswap made quite a rally during the bullish period in the crypto market at the beginning of this year. It surged from below $4 at the end of December last year to $44 by early May. It fell to $14 during the big crypto crash, but this level turned into a great support zone, which held three times as sellers were trying the downside.
UNIs/USD reversed higher eventually as the sentiment improved in the market, but the area around $30 has been providing solid resistance and it seems like this cryptocurrency has reversed down again now. The 200 SMA (purple) held as support during August, but it was eventually broken and now the 100 SMA stands in the way, Uniswap has tested this moving average several times since last Tuesday, but it has held as support.
Uniswap Daily Chart

The 100 daily SMA continues to hold as support for Uniswap
Uniswap Trade Idea
Today, the sentiment in the crypto market is quite bearish again, so the 100 SMA is under attack but it’s still holding. This might be a good place to go long on Uniswap if the 100 SMA holds as support, so those traders who are looking for a trade should follow the price action here. If the 100 SMA holds and we get a bullish reversing signal, then they should buy Uniswap with a stop loss target below the support level and take profit target above $40.
- Check out our free forex signals
- Follow the top economic events on FX Leaders economic calendar
- Trade better, discover more Forex Trading Strategies
- Open a FREE Trading Account
- Read our latest reviews on: Avatrade, Exness, HFM and XM
Related Articles


Sidebar rates
Related Posts
