There’s Nothing Stopping Axie Infinity, as AXS/BTC Heads for the TP Target
Cryptocurrencies are bouncing higher today, but Axie Infinity is leading the way

The popularity of the Axie Infinity game has been increasing this year. Axie had a revenue of $100,000 from sales in January, while now the revenue has surged to $2.05 billion. So, Axie Infinity has hit No. 1 in the world of NFT collectibles, with over 615,000 traders having bought and sold Axie Infinity NFTs in 4.88 million transactions in total. If you do the sums, it comes to $420 for an average transaction for an Axie Infinity NFT.
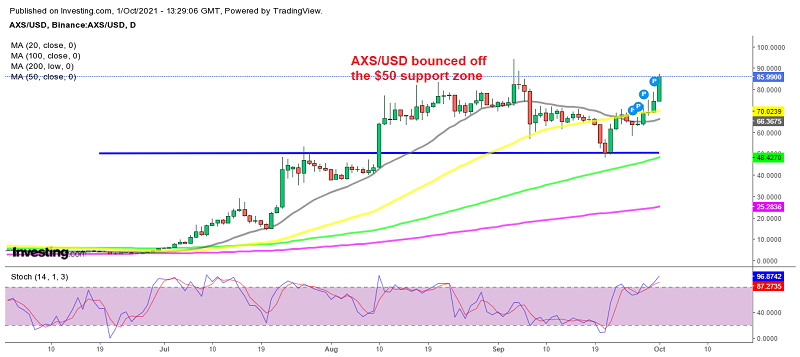
Axie Infinity Daily Chart – AXS/USD Heads for $10
These figures mean great demand for the Axie Infinity game and the native token AXS, which has resumed the bullish trend, while most cryptos have been pretty bearish in September. AXS/USD closed the month slightly higher, and today it has already resumed the bullish trend.
AXS/USD did retreat last month, breaking the 20 SMA (gray) on the daily chart at the top, which was acting as a great support indicator during the uptrend, and then breaking below the 50 daily SMA (yellow) as well. But, the previous high zone around the $50 level held well as support, and the price has bounced off that area. We called this trade down there for a buy signal, for whoever was out of the BTC/USD trade that we had opened before. The price broke above these two moving averages and is now heading for the all-time high of $94.
AXS/BTC Daily Chart – AXS/BTC Heads for $10

On the AXS/BTC daily chart, we can see that after falling below the 50 SMA, this crypto pair formed a support zone just above $0.0012, while a resistance zone formed below $0.0018. But the price has bounced off the support area and broken above the resistance. Now, it is heading for the all-time high (ATH) at $0.0019, while our take profit TP target is at $0.0020. That’s above the record high, but I strongly believe that Axie will keep growing, and that this crypto pair will reach $0.0020.
Bitcoin Daily Chart – BTC/USD Heads for $10

Bitcoin finally bouncing off the 100 daily SMA
Bitcoin turned bearish in September, closing the month around $3,500 lower, which explains the bullish momentum in AXS/BTC, since AXS/USD closed the month with gains. Bitcoin pushed below all moving averages on the daily chart, but the 100 SMA stopped the decline and provided support for more than a week.
Now Bitcoin has bounced above all moving averages, so the situation looks good. But, the bounce is still smaller than the bounce in Axie Infinity, which means that the bullish momentum in AXS/BTC will continue. We’re holding onto our signal as it heads towards our TP target.
Bitcoin Live Chart
BTC/USD
- Check out our free forex signals
- Follow the top economic events on FX Leaders economic calendar
- Trade better, discover more Forex Trading Strategies
- Open a FREE Trading Account


