EUR/USD Tests and Fails at the 200 Daily SMA, After Finally Breaking Below the 50 SMA
After reversing lower in the first few days of this year, EUR/USD was finding support at 50 daily SMA (yellow) which was acting as support.
After reversing lower in the first few days of this year, EUR/USD was finding support at 50 daily SMA (yellow) which was acting as support, pushing the lows higher for more than a week. We have had a number of ECB members trying to push back on the idea of rate cuts, which were keeping the Euro supported, hence this pair was resisting better than other major pairs.
ECB policymaker Klaas Knot cautioned against premature rate reduction, stating that achieving 2% inflation by 2025 will require gradual policy easing. The more markets ease, the less likely it will be to cut. However, ECB President Christine Lagarde stated that we are likely to decrease rates by the summer.
EUR-USD Daily Chart – The Price Bouncing Between MAs
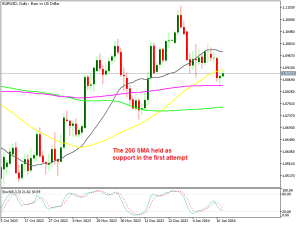
Will the 50 SMA turn into resistance?However, the economic data from the Eurozone points to a bleak picture, which will force the European Central Bank to start reducing interest rates soon after the FED starts, which will be the signal for other major central banks to start easing too.
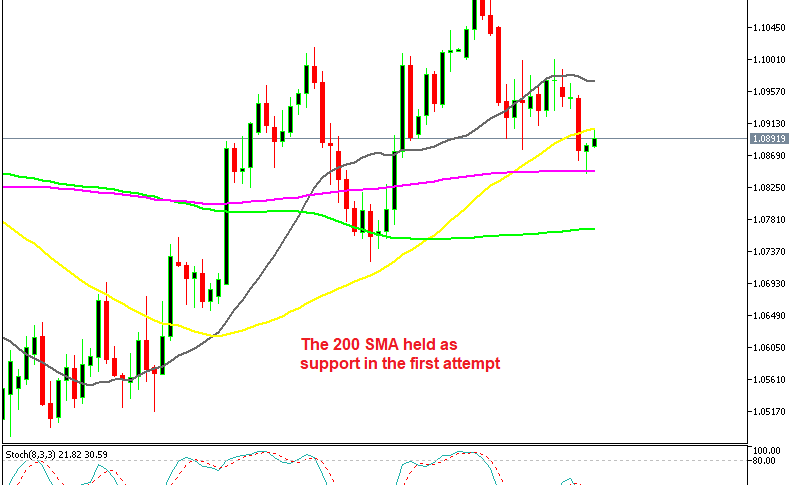
So, sellers returned yesterday and EUR/USD plummeted to a new low, testing its 200-day moving average of 1.08462 in the process. That’s where the 200 SMA (purple) was standing on the daily chart, which held as support and attracted some buying against that level after the first test, sending the price 40 pips higher.
We mentioned in previous posts that the 1.0880 – 1.09 region is a crucial support/resistance level that was broken during trading yesterday. That level should turn into resistance now and a risk-defining mark for sellers expecting further fall. So buyers have to overcome this resistance and push the price back above 1.09, while sellers should push EUR/USD below the 200 daily SMA for the decline to turn into a proper downtrend.
EUR/USD Live Chart
- Check out our free forex signals
- Follow the top economic events on FX Leaders economic calendar
- Trade better, discover more Forex Trading Strategies
- Open a FREE Trading Account
- Read our latest reviews on: Avatrade, Exness, HFM and XM
Related Articles

Sidebar rates
Related Posts
