S&P 500 Index Dips to $5,150: Fed’s Rate Stance and Global Tensions Weigh
The S&P 500 index continues to signal weakness, marked by persistent red indicators and extending losses beyond 1% today.
The S&P 500 index continues to signal weakness, marked by persistent red indicators and extending losses beyond 1% today.
This downtrend, mirrored by the fourth consecutive day of declines in the Dow Jones Industrial Average, largely stems from the Federal Reserve’s reserved stance on potential interest rate cuts.
Monetary Policy’s Role in Market Dynamics
Federal Reserve officials’ hesitation to reduce interest rates reflects a broader strategy to prioritize inflation control and seek consistent economic improvement before modifying monetary policy.
Minneapolis Fed Bank President Neel Kashkari’s remarks about potential rate cuts—contingent on inflation stability—illustrate a hawkish perspective that has rippled through investor communities, exerting downward pressure on the S&P 500.
Geopolitical Instability Fuels Market Volatility
Recent global events have escalated market anxieties, contributing to the S&P 500’s volatility. Heightened tensions in the Middle East, the ongoing Russia-Ukraine conflict, and significant seismic activity in Taiwan have collectively fueled uncertainty, affecting global market stability and economic prospects.
These geopolitical strains have unnerved investors, leading to cautious trading behaviours in equity markets, including the S&P 500.
In conclusion, the SPX price is under strain from a confluence of factors:
The Fed’s cautious monetary outlook and rising geopolitical tensions. Market participants remain vigilant, gauging economic and international developments to discern the S&P 500’s future trajectory.
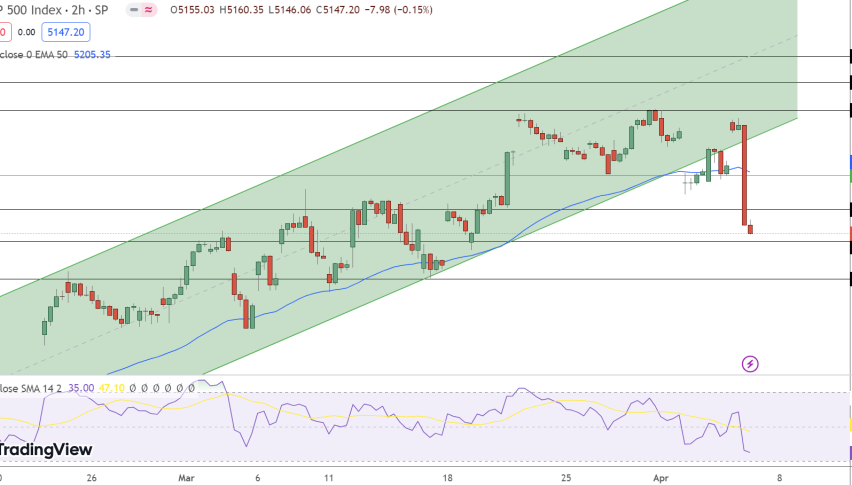
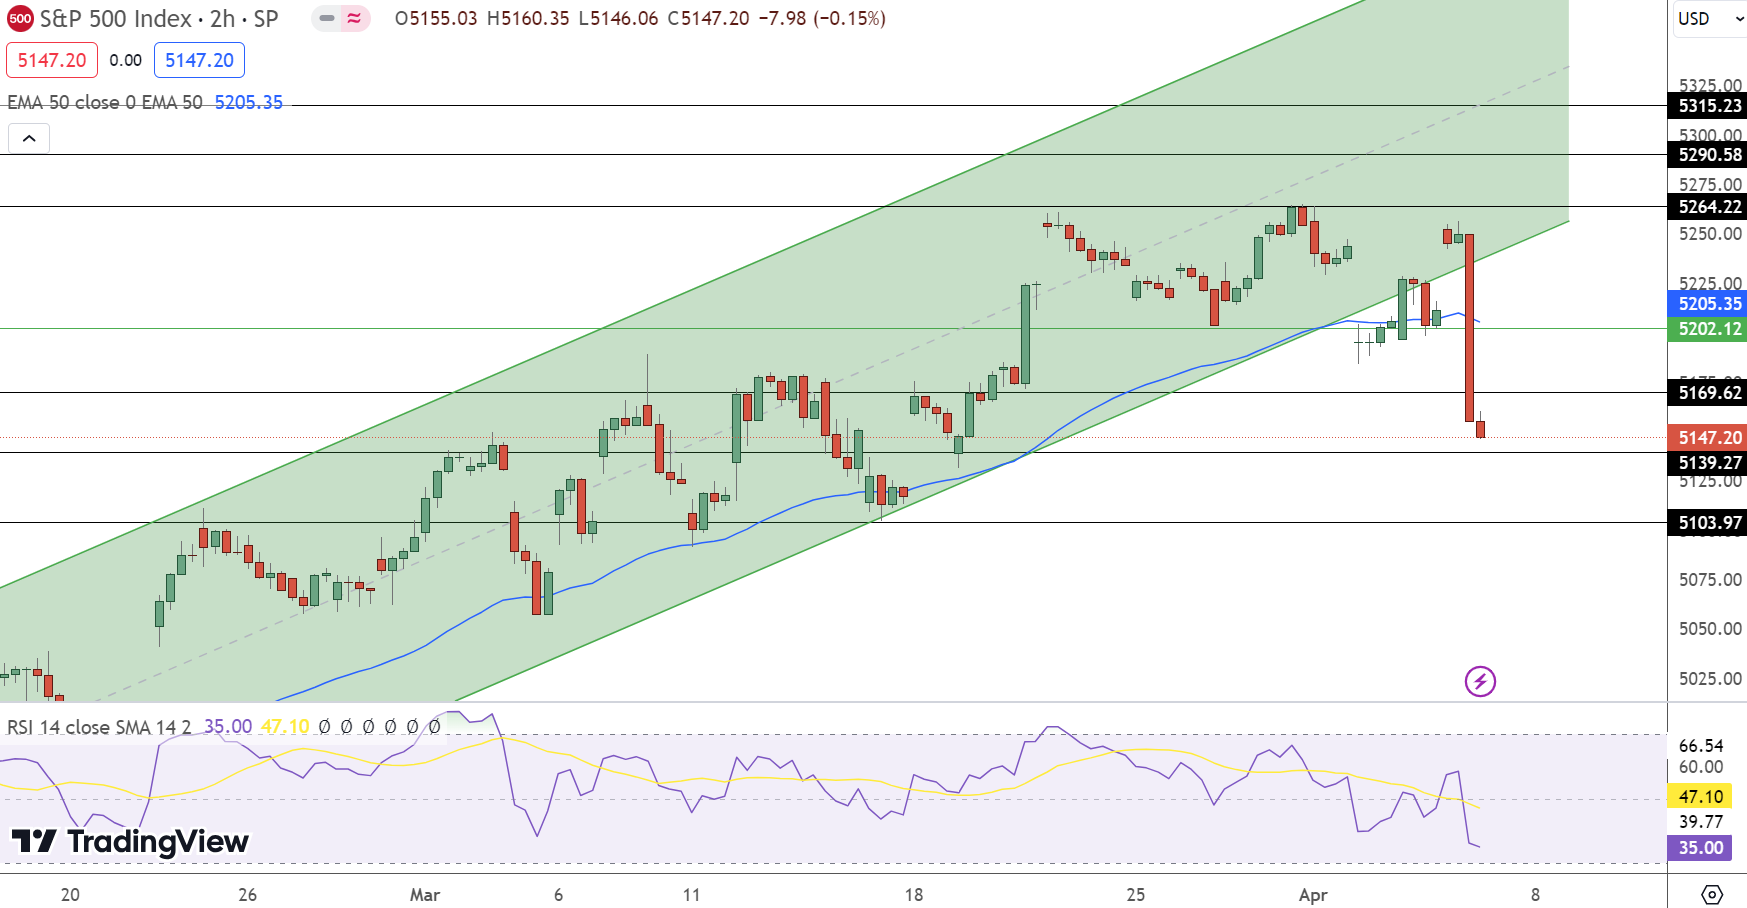
S&P 500 (SPX) Price Forecast: Technical Outlook
The S&P 500 stands at 5,147.20, reflecting a 1.23% decrease. Today’s pivot is at $5,202.12, with the index showing a bearish trend below this point.
Resistance levels are at $5,264.22, $5,290.58, and $5,315.23, while support is found at $5,169.62, $5,139.27, and $5,103.97.
The Relative Strength Index (RSI) at 35 indicates potential overselling, and the 50-day Exponential Moving Average (EMA) is $5,205.35, closely aligning with the pivot, suggesting a pivotal market sentiment.
A breach above $5,202.12 could tilt the bias towards bullish, yet current indicators lean towards a bearish outlook for the SPX.
- Check out our free forex signals
- Follow the top economic events on FX Leaders economic calendar
- Trade better, discover more Forex Trading Strategies
- Open a FREE Trading Account
- Read our latest reviews on: Avatrade, Exness, HFM and XM
Related Articles


Sidebar rates
Related Posts
