GBP/USD Waves Bullish Flag – Construction PMI Up Next
The Cable is trading right below the upper trendline resistance level of $1.3100. This pattern is also called a bullish flag.
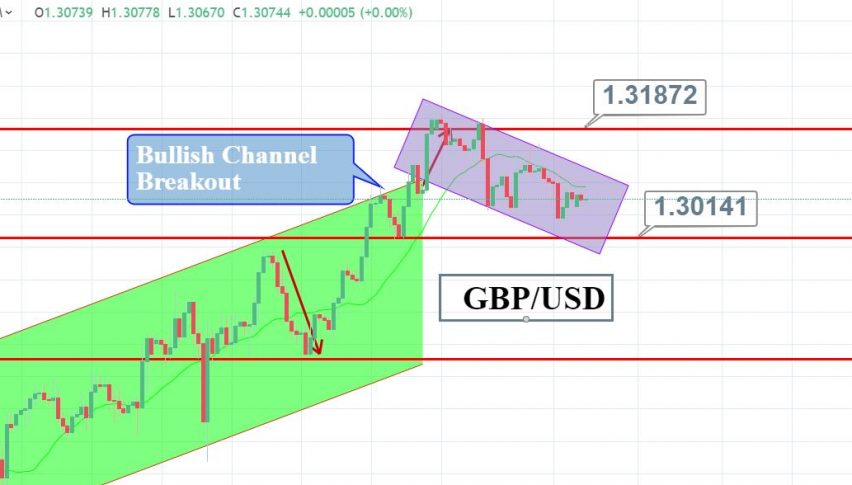
Before we proceed, let me draw your attention towards a small bearish channel setup on the hourly timeframe. The Cable is trading right below the upper trendline resistance level of $1.3100. This pattern is also called a bullish flag, and typically drives buying trend in the market. You can see a candlestick pattern ‘bearish marubozu’ which is the bearish pattern in nature.
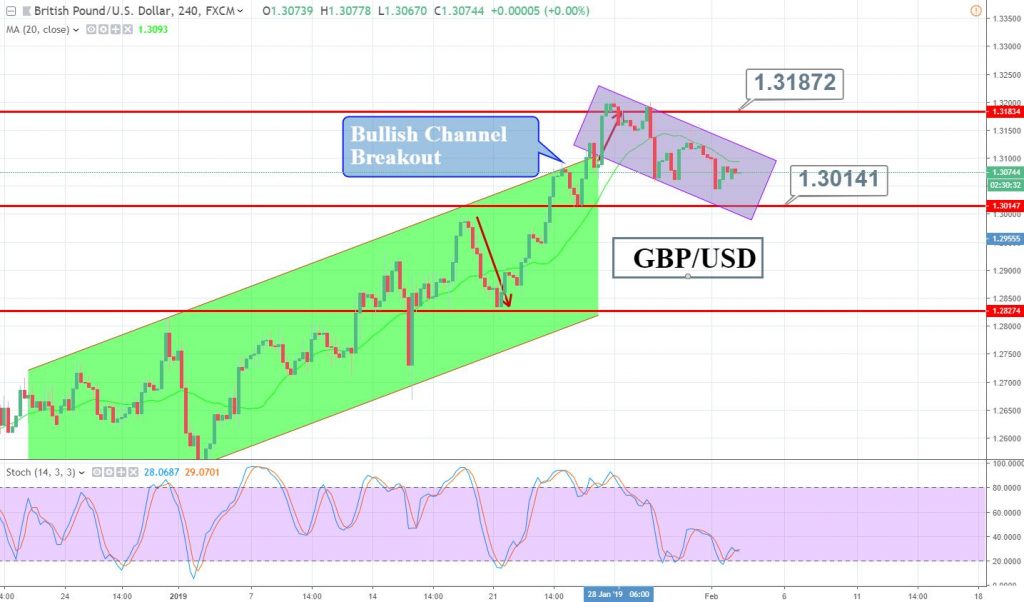
Alongside, the RSI and Stochastics are coming out of an oversold area, implying the market is already at low and bullish may dominate the market for correction.
At 9:30 (GMT), the focus will remain on the UK construction PMI data. As per forecast, the construction PMI seems to show a slight drop from 52.8 to 52.6. Weaker data will add more selling pressure on the GBP/USD today.
Support Resistance
1.3043 1.3115
1.3007 1.3151
1.2935 1.3223
Key Trading Level: 1.3079
GBP/USD – Trading Plan
Investors are advised to keep a closer eye on a thin trading range of $1.3090. The idea is to stay bullish above $1.3090 and bearish below $1.3085 to target 50 pips on both sides.
Keep following us for forex trading signals and updated trade ideas. Good luck!
- Check out our free forex signals
- Follow the top economic events on FX Leaders economic calendar
- Trade better, discover more Forex Trading Strategies
- Open a FREE Trading Account
- Read our latest reviews on: Avatrade, Exness, HFM and XM
Related Articles


Sidebar rates
Related Posts
