XRP Price Prediction: $0.52 Pivot Point Amid Largest Token Sale Since 2017
In a significant market move, Ripple plans to sell 400 million XRP in June 2024, marking the largest token sale since 2017.

In a significant market move, Ripple plans to sell 400 million XRP in June 2024, marking the largest token sale since 2017.
This decision comes amid increased market volatility, sparking intense reactions from investors. Ripple’s recent unlocking of a billion XRP, valued at $520 million, through the XRP Ledger’s escrow system, has further intensified market speculation.
Implications of the Token Sale
Ripple typically transfers 200 million XRP to its treasury each month. However, this time, an additional 200 million XRP was added by a dormant account known as ‘Ripple (35)’ to ‘Ripple (1)’, suggesting a larger sale.
David Schwartz, CTO of Ripple, stated this sale is a strategic move to manage Ripple’s substantial XRP holdings, support ongoing operations, and stabilize the market by preventing sharp devaluation.
Transparency and Market Impact
Since 2017, Ripple has reserved up to 350 million XRP monthly for sales. In 2024, monthly sales varied between 200 and 260 million XRP. If the planned sale proceeds, it could create market turbulence.
All transactions are transparent and verifiable on the blockchain via XRP scanning. Ripple currently holds 4.8 billion XRP in its portfolio and 40.1 billion in escrow, with releases scheduled over a 42-month period to maintain investor confidence.
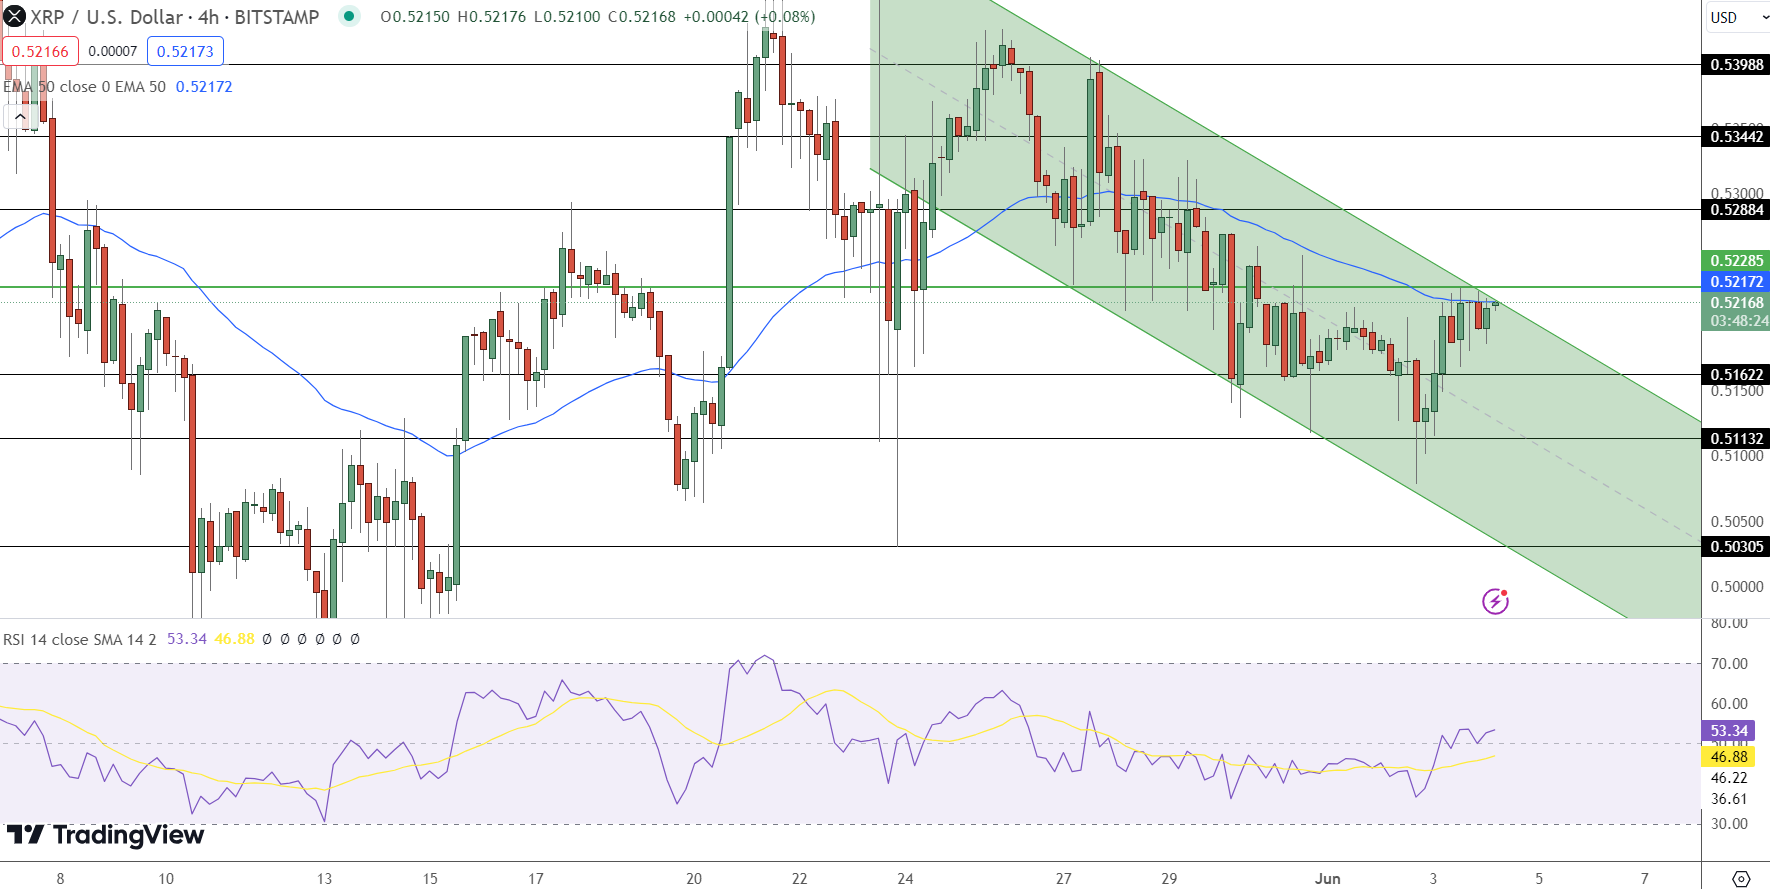
XRP Price Forecast: Downward Channel In-Play
XRP/USD is currently trading at $0.5217, indicating a potential bullish trend. The pivot point at $0.5215 serves as a critical support level. Immediate resistance is observed at $0.5230, followed by $0.5288 and $0.5344. On the downside, support levels are at $0.5162, $0.5113, and $0.5030.
- Pivot Point: $0.5215
- Immediate Resistance: $0.5230
- Next Resistance: $0.5288
- Immediate Support: $0.5162
The Relative Strength Index (RSI) stands at 53.34, indicating neutral momentum. The 50-day Exponential Moving Average (EMA) is at $0.5217, acting as resistance. A downward channel is extending resistance around $0.5230. A breakout above this level can expose XRP to higher targets.
- Check out our free forex signals
- Follow the top economic events on FX Leaders economic calendar
- Trade better, discover more Forex Trading Strategies
- Open a FREE Trading Account
- Read our latest reviews on: Avatrade, Exness, HFM and XM
Related Articles


Sidebar rates
Related Posts
