Forex Signals Brief June 26: Australian CPI Up for the 3rd Month
The major event is already behind us, with Australian CPI inflation posting another increase in May, sending AUD higher

The FX market experienced slow price action yesterday, as the dollar rebounded from its Monday losses. EUR/USD slipped below 1.07 in the European session, while USD/JPY stayed around 160.00 earlier this week before pulling back due to concerns over possible intervention.
USD/CAD was a notable mover following the unexpectedly high CPI figures, but the market’s reaction was revealing. Initially, the CAD saw a strong 60-point gain, but two-thirds of this increase quickly dissipated. This indicates that the market might view the CPI report as somewhat deceptive, potentially deterring the BOC from making necessary rate cuts.
Equities continued to exhibit volatility, with tech stocks bouncing back from the previous day’s losses, with Nvidia gaining nearly 7%. The Fed’s communication maintains a cautious, wait-and-see stance, with market projections anticipating a 46 basis point reduction this year. Attention is now turning to Friday’s PCE inflation numbers.
Today’s Market Expectations
Today we had the Australian CPI inflation report for May early in the morning, with expectations for a 2 points increase in the headline CPI to 3.8% which would be the third in a row. The latest CPI report shows that the weighted CPI year-on-year for May is 4.0%, higher than the expected 3.8% and up from 3.6% in April. The seasonally adjusted CPI year-on-year also increased to 4.1%, compared to 3.8% in the previous month. The seasonally adjusted CPI month-on-month remained stable at 0.2%, matching expectations. Additionally, the annualized trimmed mean CPI year-on-year stayed consistent at 4.4%, the same as the prior month.
In the US session we have the New Home Sales report to be released, with expectations hoovering around 636K which is close to last month’s 634K. That would show stabilization after the miss and the decline in the previous month. The US EIA Crude Oil Inventories are expected to show a 2.6 million barrel drawdown, after the 2.5 million barrel drawdown we saw in the previous week.
Yesterday the volatility was low again, with the USD making a comeback after Monday’s decline. Bitcoin was volatile again, falling below $60,000 and bouncing above. We opened 7trading signals in total, with 6 forex signals closing at he end of the day. We ended up with three winning trades and three losing ones, however one of the winning Gold signals was a long term trade.
Selling Gold After the Strong Rejection Last Week
Over the past two months, Gold has been establishing lower peaks, with a support zone around $2,270 indicating a potential decline to $2,180 if this support level is breached. Early last Friday, buyers attempted to surpass the high set earlier in the month but fell short. Later that day, sellers reemerged, pushing the price down by $50 to $2,316. On Monday, gold prices regained some ground as the US dollar weakened, although they trailed behind other assets such as major currencies, which made substantial gains against the US dollar. However, selling pressure resurfaced on Wednesday, prompting gold prices to revert to previous levels and close below $2,320.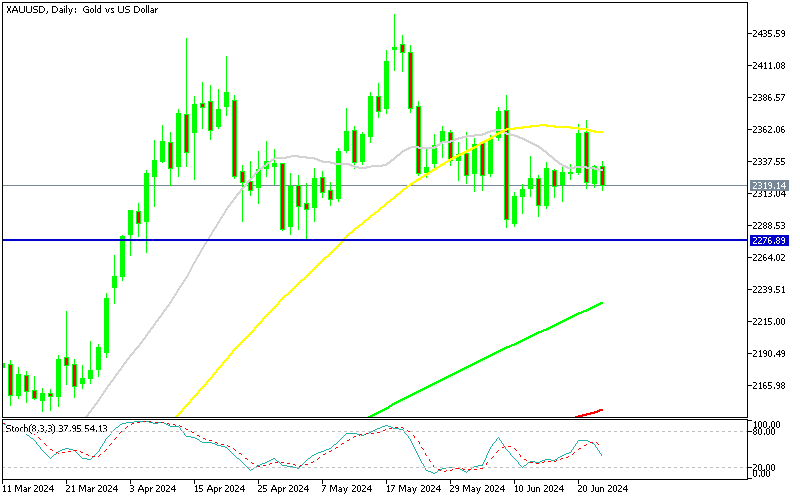
XAU/USD – Daily chart
EUR/GBP Buyers Fail at the 20 Daily SMA
EUR/GBP recently breached the critical support level of 0.85, driven by political developments in Europe following the recent European elections, resulting in a 30-pip downward gap. The price briefly dipped below 0.84 before rebounding and trading 50 pips higher, but it remains confined between two moving averages. Last week, there was an attempt by buyers to initiate a reversal, pushing the price upward, but this effort failed as the 20 SMA (gray) acted as strong resistance, rejecting the price. Sellers regained control this week, pushing the pair back down to monthly lows.
EUR/GBP – Daily Chart
Cryptocurrency Update
Bitcoin Returns Above $60,o00
Bitcoin has been in a downtrend for nearly two weeks, currently hovering around the $60,000 mark. We’re weighing whether to buy now or wait for a potential further decline. With today’s accelerated drop, entering the Bitcoin market on the long side now seems risky, akin to catching a falling knife. Therefore, we’re monitoring price movements closely to identify signs of a bottom forming. The 60K broke yesterday, so our focus shifted to the early May low around $57,000 as a potential entry point for long positions. But the 200 SMA (purple) held the decline on Monday and BTC bounced around $3,000 higher.
BTC/USD – Daily chart
Ethereum Slips Below $3,400
Since the launch of its ETF, Ethereum (ETH) has experienced significant volatility, peaking at $3,832.50. This surge was driven by growing market confidence following a positive SEC ruling on spot Ether ETFs. Ethereum’s price surged by 25% from its previous highs, signaling robust investor interest and market demand. However, despite this upward trend, Ethereum has recently fallen below the $3,500 mark. The 50-day Simple Moving Average (yellow line), which had provided support on multiple occasions, gave way over the weekend. On Monday, selling pressure intensified, pushing the price below the 100-day SMA (green line) but it returned back above it quickly.
ETH/USD – Daily chart
- Check out our free forex signals
- Follow the top economic events on FX Leaders economic calendar
- Trade better, discover more Forex Trading Strategies
- Open a FREE Trading Account
- Read our latest reviews on: Avatrade, Exness, HFM and XM
Related Articles


Sidebar rates
Related Posts
