Trying the Downside in EUR/JPY Again Today
EUR/JPY stretched the retrace higher today, but the H1 and H4 charts are pointing to a bearish reversal now
EUR/JPY turned bearish at the end of last week and the bearish momentum picked up pace this week after comments from the US and China that suggest an escalation of the trade war, which we thought was coming to an end. We decided to get in on this downtrend yesterday and opened a sell signal as this pair was retracing higher.
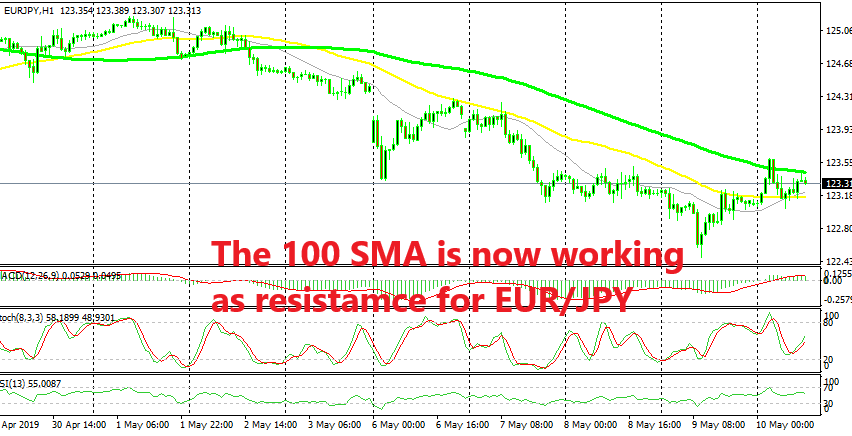
When we opened this signal, this pair was trading below the 20 MSA (grey) on the H1 chart and the 50 SMA (yellow) was standing right above it, which provided resistance during most of the US session. But, that moving average was broken during the Asian session today and the price popped around 60 pips higher, which scorched our trade.
But now another good opportunity to sell this pair has appeared. The price pierced the 100 SMA (green) but it reversed back down pretty quickly. We saw a bounce off the 50 SMA (yellow) in the last several hours, but the 100 MSA is now acting as resistance. The previous H1 candlestick formed an upside-down pin which is a reversing signal, so this chart is pointing to a bearish reversal now and a continuation of the downtrend.
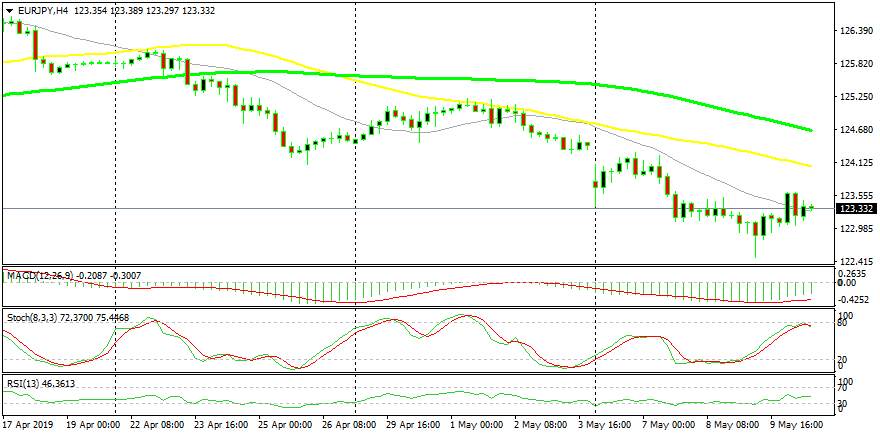
The H4 chart is overbought now as the stochastic indicator shows
The retrace higher is complete on the H4 chart as well and USD/JPY is finding resistance at the 50 SMA at the moment and looks like it is going to turn bearish soon. So, we just opened another sell signal in EUR/JPY, hoping that the downtrend will get going again.
- Check out our free forex signals
- Follow the top economic events on FX Leaders economic calendar
- Trade better, discover more Forex Trading Strategies
- Open a FREE Trading Account
- Read our latest reviews on: Avatrade, Exness, HFM and XM
Related Articles


Sidebar rates
Related Posts
