Gold Has Bounced Off the 200 Daily SMA for the 3rd Time
Gold turned bearish on long term charts in February, but we see it bounce off the 200 SMA yesterday which might threaten the trend
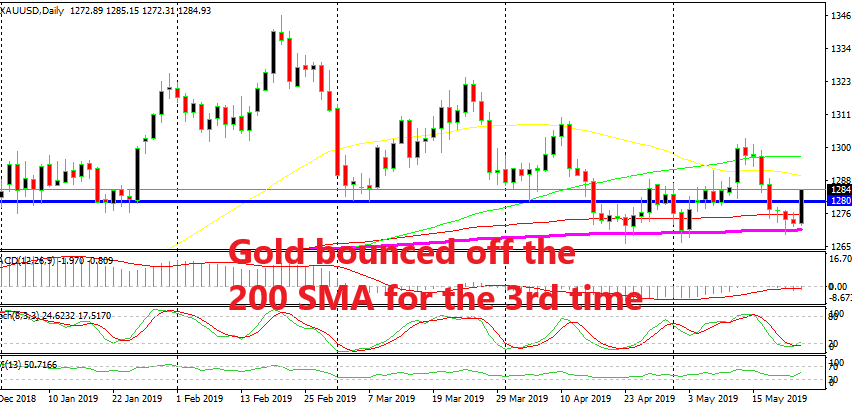
GOLD made a reversal in February after it formed an upside-down candlestick, which is a great reversing signal and it worked perfectly. Since then, the trend has changed because the buyers can’t make new highs, instead, the highs keep getting lower every time, as you can see on the daily chart above.
Although the sellers found some support at $1,280 which held its ground three times. But that level was broken last month and the sellers pushed lower, but this time a new support appeared. The 200 SMA (purple) is standing at around $1,270 and it held the first attempt last month, it held on the second attempt early this month and it reversed the price back up again yesterday.
The jump yesterday came from fundamentals after the US manufacturing and services PMI reports showed that these sectors fell close to contraction this month. This makes the US the last major country to edge closer to contraction. So, it seems like things are going from bad to worse on a global scale. As a result, Gold jumped $12 higher after those reports, so the 200 SMA is safe once again.
Although, this might make Gold traders think that the 200 SMA is not letting go and the trend might change as a result, but the support at $1,280 also held three times. So we will see if Gold really makes a bullish reversal now or if it turns bearish and breaks the 200 SMA on the fourth attempt like it did with the previous support level.
- Check out our free forex signals
- Follow the top economic events on FX Leaders economic calendar
- Trade better, discover more Forex Trading Strategies
- Open a FREE Trading Account