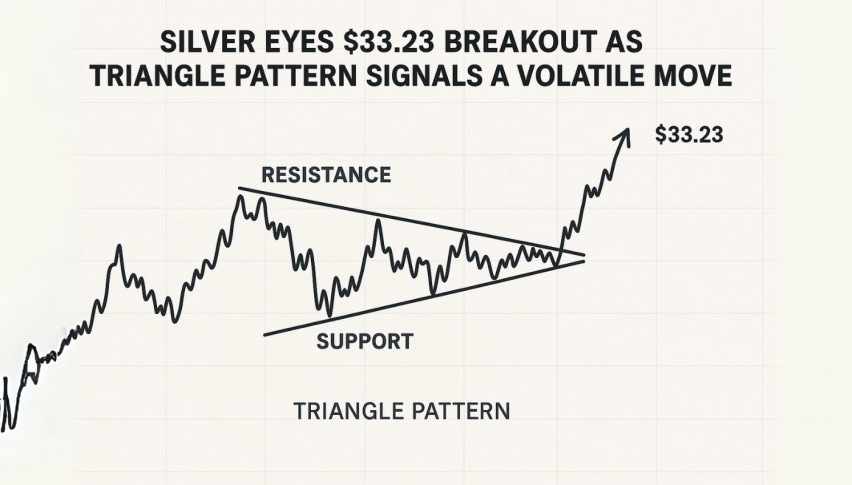
Silver Eyes $33.23 Breakout as Triangle Pattern Signals a Volatile Move
Silver is trading sideways at $32.35, in a tightening symmetrical triangle that has everyone waiting for a breakout.
Quick overview
- Silver is currently trading sideways at $32.35 within a tightening symmetrical triangle, indicating a potential breakout is imminent.
- Gold experienced its worst week since November due to increased risk appetite following a temporary US-China trade truce.
- Moody's recent downgrade of the US sovereign credit rating has shifted sentiment back towards gold as a safe-haven asset.
- Traders are advised to wait for a clear breakout confirmation before entering positions, with specific targets set for both bullish and bearish scenarios.
Silver is trading sideways at $32.35, in a tightening symmetrical triangle that has everyone waiting for a breakout. Gold had its worst week since November, as risk appetite surged following a temporary US-China trade truce. The US dollar index (DXY) fell 0.3% on Monday, making dollar denominated precious metals more attractive to international buyers.
Sentiment changed after Moody’s downgraded the US sovereign credit rating by one notch – citing rising debt risks. “That downgrade, combined with a return to risk-off trading, has added some shine back to gold,” said Tim Waterer, Chief Market Analyst at KCM Trade.
But the real wild card is Donald Trump’s tariff threats. Treasury Secretary Scott Bessent confirmed the administration will impose duties on countries that don’t engage in “good faith” trade negotiations. That has rekindled fears of another round of global uncertainty, and a potential tailwind for safe-haven assets like gold and silver.
XAU/USD Technical Outlook: Triangle Squeeze in Silver Charts
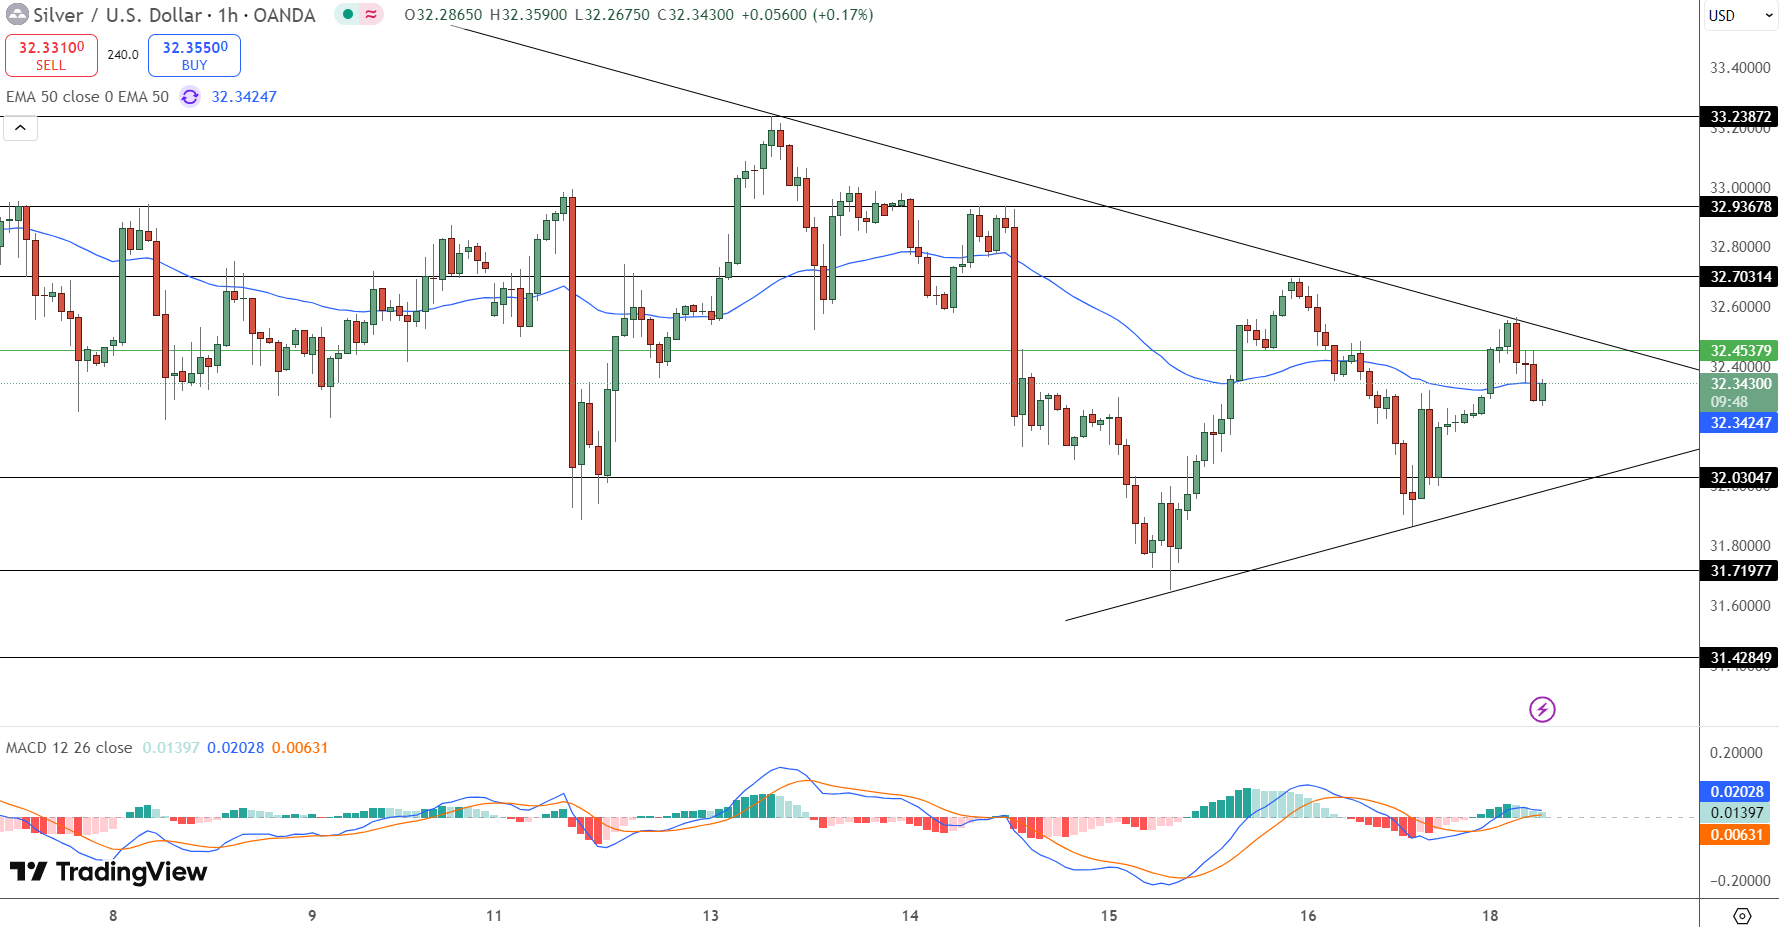
Technically, silver (XAG/USD) is in a well defined symmetrical triangle on the hourly chart. Prices are trapped between lower highs at $32.70 and rising support at $32.03. This squeeze means pressure is building and a directional move is imminent.
Silver was rejected at the 50 period exponential moving average (EMA) of $32.34, which is also the upper trendline. That was a bearish engulfing candle, often a sign of short term declines.
But the MACD is trying to crossover and the structure of higher lows suggests buyers are defending key levels. If bulls can take control and break above $32.70, the upside targets are $32.93 and $33.23.
Trade Setups: When to Enter, When to Wait
Wait for a clear breakout confirmation before entering a trade:
-
Bullish breakout: Above $32.70 with volume confirmation
-
Upside targets: $32.93 and $33.23
-
-
Bearish breakdown: Below $32.03, invalidating higher low structure
-
Downside risk: $31.72 and $31.43
-
-
Stop-loss guidance: Just beyond the triangle boundaries
First time trader? Think of the triangle as a coiled spring. When it finally unwinds the move can be big. Wait for a full candle close outside the triangle and don’t chase the breakout. Let the chart speak.
- Check out our free forex signals
- Follow the top economic events on FX Leaders economic calendar
- Trade better, discover more Forex Trading Strategies
- Open a FREE Trading Account
- Read our latest reviews on: Avatrade, Exness, HFM and XM
Related Articles
Sidebar rates
