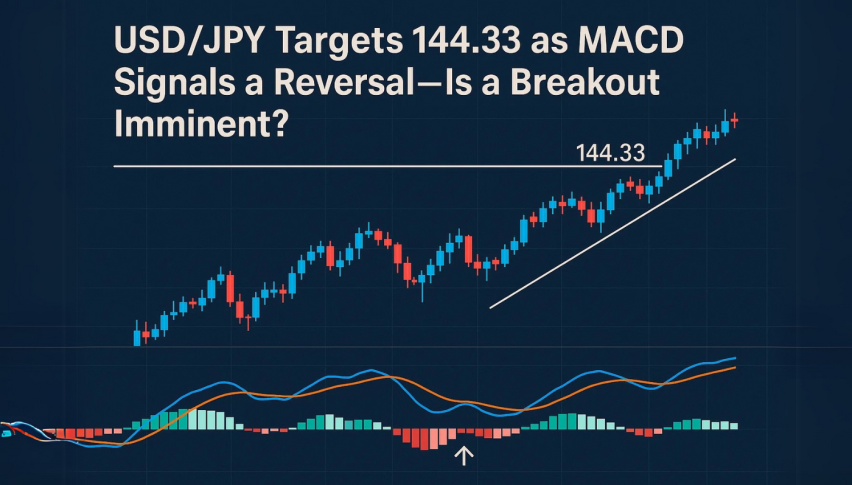
USD/JPY Targets 144.33 as MACD Signals a Reversal—Is a Breakout Imminent?
USD/JPY is holding steady near 143.40, bouncing off recent lows. Traders are digesting the mixed signals from the Fed and BoJ...
Quick overview
- USD/JPY is stable around 143.40, influenced by mixed signals from the Fed and BoJ.
- BoJ's hawkish stance suggests potential rate hikes, while the Fed hints at possible rate cuts later this year.
- Geopolitical tensions and weak US economic data are limiting the dollar's rebound.
- Upcoming economic data will be crucial in determining the short-term direction for USD/JPY.
USD/JPY is holding steady near 143.40, bouncing off recent lows. Traders are digesting the mixed signals from the Fed and BoJ, setting up for potential volatility. While the Fed is hinting at rate cuts later this year, the BoJ is getting more hawkish.
BoJ Governor Kazuo Ueda reinforced the hawkish tone by saying more rate hikes if economic and price conditions allow. Former BoJ board member Makoto Sakurai said the central bank might stop reducing government bond purchases, reflecting market caution. BoJ meeting minutes showed internal debates about slowing tapering amid yield concerns, adding uncertainty.
Key points:
-
BoJ is hawkish for the yen.
-
Fed rate cuts are a drag on the dollar.
Geopolitics and Weak US Data Weigh on Dollar
The dollar is not rebounding much due to geopolitics and weak data. Ukraine-Russia tensions are driving safe-haven flows into the yen. The latest US ISM Manufacturing PMI came in at 48.5 in May, below expectations, its third straight contraction.
Market is dovish on the Fed, with 70% chance of two rate cuts by year-end. Chicago Fed President Austan Goolsbee said policy easing could come once trade uncertainties subside. This dovish bias is capping USD strength even as the dollar tries to rebound.
Upcoming data, including JOLTS Job Openings and NFP, will decide short-term direction for USD/JPY.
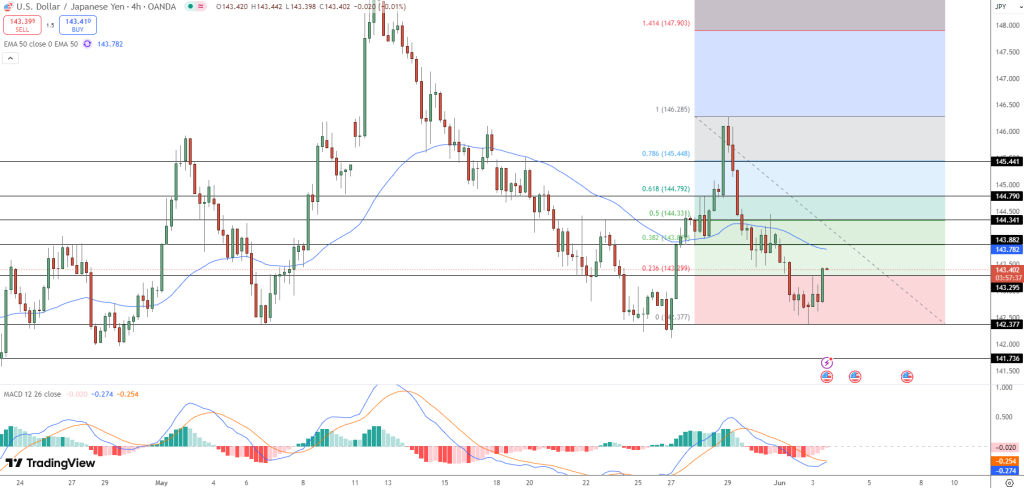
Technicals: USD/JPY Consolidation Sets Up a Breakout
USD/JPY is consolidating on the 4-hour chart and is about to break out. The pair is testing the 50-period EMA at 143.78, a key resistance. Fibonacci retracement levels add structure: resistance at 144.33 and 144.79 align with the 50% and 61.8% retracement zones, support at 143.29 and 142.37.MACD is less negative and signal lines are flat, bearish momentum is fading. A MACD bullish crossover and close above 143.78 will confirm the breakout. Look for bullish candlestick patterns like engulfing or three white soldiers to confirm.
For Traders:
-
Entry: Long above 143.78 on confirmation.
-
Target: 144.33 (first), 144.79.
-
Stop-Loss: Tight below 143.29.
- Check out our free forex signals
- Follow the top economic events on FX Leaders economic calendar
- Trade better, discover more Forex Trading Strategies
- Open a FREE Trading Account
- Read our latest reviews on: Avatrade, Exness, HFM and XM
Related Articles


Sidebar rates
Related Posts
