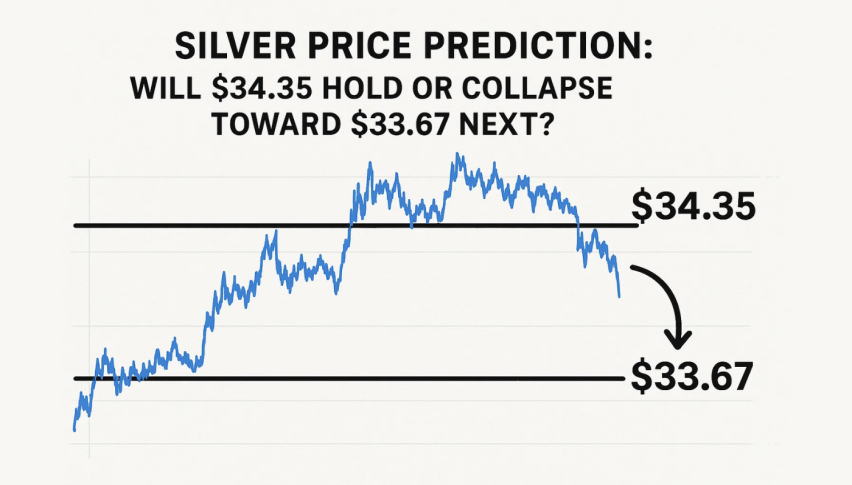
Silver Price Prediction: Will $34.35 Hold or Collapse Toward $33.67 Next?
Silver (XAG/USD) is taking a breather after a sharp rally from $33.08 to $34.78, marking its highest level in weeks.
Quick overview
- Silver (XAG/USD) has recently rallied from $33.08 to $34.78, its highest level in weeks, driven by a decline in the U.S. Dollar Index and softer Treasury yields.
- Weak U.S. economic data, including a contraction in the ISM services PMI and slow job growth, is fueling demand for safe-haven metals like silver.
- Technical indicators show that silver is consolidating above critical support levels, but warning signs of buyer fatigue are emerging.
- Traders are advised to wait for a clear breakout or breakdown before confirming market direction, with key levels at $34.12 and $34.35.
Silver (XAG/USD) is taking a breather after a sharp rally from $33.08 to $34.78, marking its highest level in weeks. The recent surge came amid a 0.5% slide in the U.S. Dollar Index (DXY) and softer Treasury yields, both of which increased demand for safe-haven metals.
Investors are reacting to weak U.S. data, including a drop in the ISM services PMI to 49.9, the first contraction in a year, and an ADP employment report showing the slowest job growth in over two years. With economic momentum fading and geopolitical tensions still simmering across Russia, Ukraine, China, and Iran, silver remains part of the broader flight to safety.
“There’s still plenty of upside for gold—and by extension, silver—especially in this kind of environment,” said Daniel Pavilonis, senior market strategist at RJO Futures.
Technical Breakdown: MACD and Fib Levels
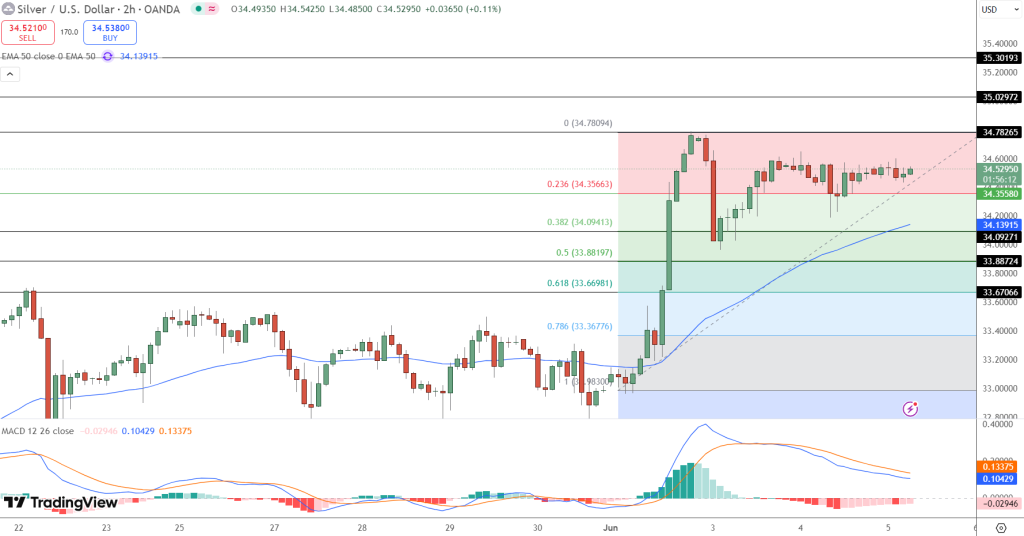
Silver is currently consolidating just above $34.35, a critical 23.6% Fibonacci retracement level, and near a rising trendline from early June’s breakout. The 50-period EMA, sitting at $34.12, adds additional support, but warning signs are emerging on the momentum front.
Here’s what the chart says:
- MACD histogram has flattened; signal line is crossing lower
- Doji and spinning tops near resistance suggest buyer fatigue
- Price compression below $34.78 implies indecision among bulls
If bulls fail to defend the $34.12–$34.35 zone, the structure could unwind quickly.
Trade Outlook: Bounce or Breakdown?
Silver is walking a fine line. On the bullish side, defending $34.35 and printing a bullish engulfing or hammer candle could trigger a run back toward $35.02 and possibly $35.30, the next major resistance levels.
But if bears take control:
- A clean break below $34.12 could lead to $33.88 (50% Fib)
- Deeper downside targets include $33.67 (61.8% Fib support)
Traders should wait for a 2-hour candle close beyond either boundary before confirming direction. Watch MACD closely—it’s the canary in this momentum mine.
- Check out our free forex signals
- Follow the top economic events on FX Leaders economic calendar
- Trade better, discover more Forex Trading Strategies
- Open a FREE Trading Account
- Read our latest reviews on: Avatrade, Exness, HFM and XM
Related Articles

Sidebar rates
Related Posts
