Ripple: XRP Faces Blood Bath
Several factors have contributed to XRP's tepid momentum, creating persistent selling pressure this month.

Quick overview
- XRP is experiencing selling pressure due to a confirmed bearish head-and-shoulders pattern, suggesting further declines toward $2.
- The token has struggled to maintain momentum above the $2.2 support level, leading to declining buyer confidence and potential retests of $1.96.
- Technical indicators show strong bearish momentum, with the RSI trending downward and the MACD indicating a sell-off.
- Future price movements will be influenced by factors such as regulatory decisions and ETF approvals, with projections suggesting XRP could reach $5.50 by the end of 2025.
Live XRP/USD Chart
Several factors have contributed to XRP’s tepid momentum, creating persistent selling pressure this month. Among the main motivators are technical breakdown patterns; XRP confirmed a bearish head-and-shoulders formation that predicts additional declines toward $2.

The token has struggled to maintain momentum above the crucial $2.2 support level, resulting in numerous rejections and declining buyer confidence. If its 50-day EMA rejects it, XRP may continue to fall and retest its next daily support level at $1.96.
A strong bearish momentum is evident on the daily chart, with the RSI at 45, below its neutral level and trending downward. Additionally, the MACD indicator on the daily chart has displayed a bearish crossover, signaling a sell-off and a downward trend.
Reputable financial institutions such as Standard Chartered provide the most reliable predictions, projecting that XRP might likely reach $5.50 by the end of 2025, mainly due to expected ETF approvals and increased interest.XRP may soon challenge its all-time high resistance level of $3.4 if investor confidence gains momentum.
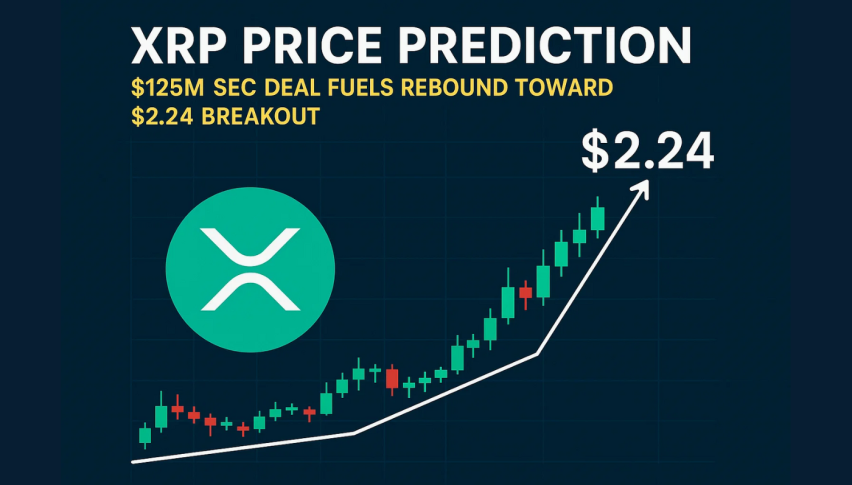
Factors such as Judge Torres’ decision, the SEC’s appeal strategies, and ETF-related news will influence XRP’s short-term prospects. A breakout above $2.2 might indicate a move towards the 50-day EMA.
A sustained move through the 50-day EMA could lead to $2.5 and the high of $2.68 on May 12. However, if the 200-day EMA declines, the bears might target sub-$2 and the $1.9 support level.
- Check out our free forex signals
- Follow the top economic events on FX Leaders economic calendar
- Trade better, discover more Forex Trading Strategies
- Open a FREE Trading Account


