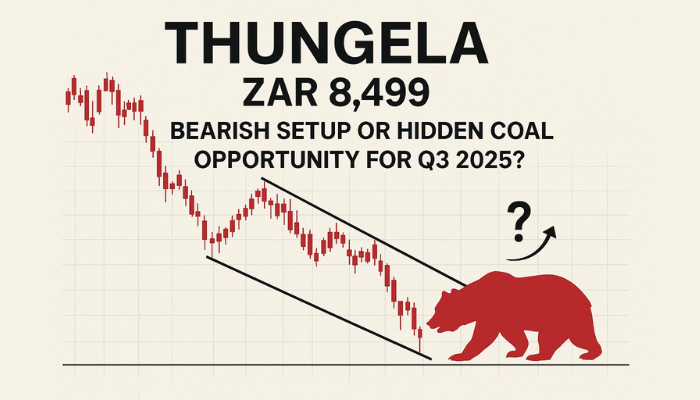
Thungela at ZAR 8,499: Bearish Setup or Hidden Coal Opportunity for Q3 2025?
Thungela Resources Ltd (JSE: TGA) is trading at ZAR 8,499, down 1.83%, and pressing near critical support at ZAR 8,473. While the near-term.
Quick overview
- Thungela Resources Ltd is currently trading at ZAR 8,499, facing critical support at ZAR 8,473 amid a bearish near-term outlook.
- Rising LNG prices in Asia are increasing the attractiveness of thermal coal, benefiting exporters like Thungela as countries seek to stabilize energy costs.
- Geopolitical tensions in the Middle East and U.S. Federal Reserve policies are impacting market sentiment, while the weakening South African rand may enhance Thungela's revenue in USD.
- Technically, Thungela remains in a bearish trend unless it can reclaim resistance at ZAR 8,730, with potential further declines if it breaks below ZAR 8,473.
Thungela Resources Ltd (JSE: TGA) is trading at ZAR 8,499, down 1.83%, and pressing near critical support at ZAR 8,473. While the near-term chart paints a bearish picture, global macro dynamics suggest a more nuanced outlook. Rising liquefied natural gas (LNG) prices in Asia, hovering in the $12–14/MMBtu range, have widened the cost gap between gas and thermal coal.
As energy bills spike, nations like Japan and South Korea are turning to coal to stabilize costs, benefiting exporters like Thungela during peak seasonal demand.
China and India are also reassessing their energy mix, pivoting toward coal to hedge against oil and gas price volatility. This shift supports a longer-term thesis for higher thermal coal exports—even as short-term momentum weakens.
Middle East Risk and Fed Policy Shape Sentiment
Ongoing geopolitical stress in the Middle East, particularly around the Strait of Hormuz, continues to elevate energy security risks. Following U.S. military strikes in the region, investors have fled to safe-haven assets, but coal remains strategically appealing as a stable, land-deliverable alternative.
That said, rising oil prices could offset some gains by increasing Thungela’s shipping and operational expenses. Adding to the complexity, the U.S. Federal Reserve’s hawkish stance and the strengthening U.S. dollar may suppress commodity rallies. Still, the weakening South African rand acts as a cushion—enhancing Thungela’s USD-priced revenue when converted locally.
Thungela Resources Ltd (JSE: TGA) Technical Outlook: Bearish Bias Dominates
The technical chart tells a clear story: Thungela is trapped inside a well-defined descending channel. It’s trading below both the 50-period EMA at ZAR 8,697 and horizontal resistance at ZAR 8,730, with no bullish reversal signals—no hammers, engulfings, or MACD divergence in sight.
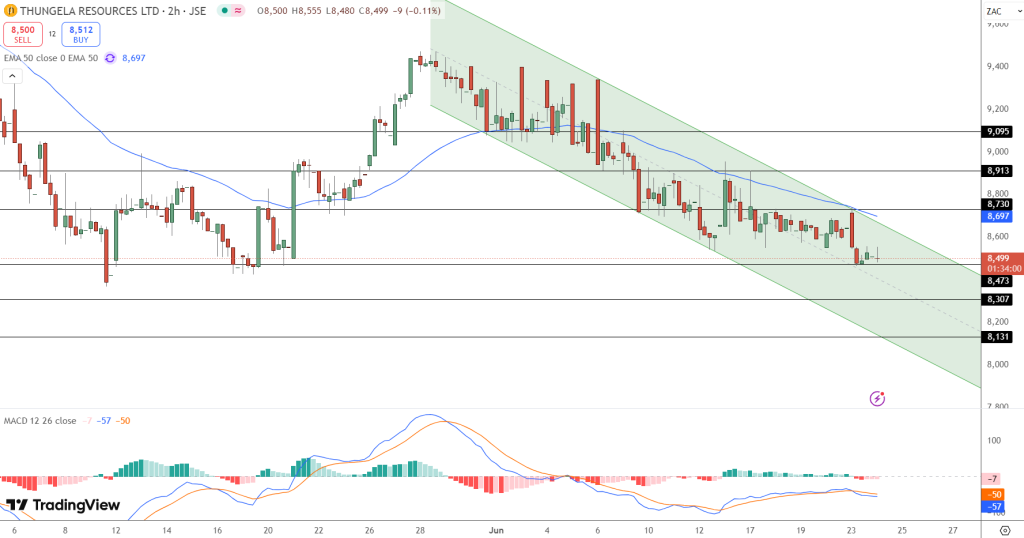
Key levels to watch:
- Support: ZAR 8,473 (near-term), ZAR 8,307, ZAR 8,131
- Resistance: ZAR 8,697 (EMA), ZAR 8,730 (channel top)
Candlestick patterns remain indecisive—short-bodied candles with long wicks—signaling hesitation. If TGA breaks and closes below ZAR 8,473 on the 2-hour chart, a further slide to ZAR 8,131 looks likely.
Key Takeaways for Traders and Investors:
- Rising LNG prices in Asia are making thermal coal more attractive.
- Geopolitical risks and Fed policy continue to influence market sentiment.
- Technically, Thungela remains bearish unless bulls reclaim ZAR 8,730.
Investors should balance the bearish short-term setup with supportive long-term demand drivers. Risk is real, but so is opportunity.
- Check out our free forex signals
- Follow the top economic events on FX Leaders economic calendar
- Trade better, discover more Forex Trading Strategies
- Open a FREE Trading Account
- Read our latest reviews on: Avatrade, Exness, HFM and XM
Related Articles


Sidebar rates
Related Posts
