btc-usd
Forex Signals Brief June 30: Packed Week Ahead – PMIs, CPI, NFP and More
Markets will watch a busy calendar this week with crucial inflation, labor, and PMI data from major economies as investors weigh recession..
•
Last updated: Sunday, June 29, 2025

Quick overview
- Global equity markets showed resilience last week, buoyed by easing tensions in the Middle East and fresh all-time highs for U.S. stocks.
- U.S. economic data revealed mixed signals, with cooling consumer spending raising concerns about stagflation while core inflation remains high.
- Commodities faced declines, with gold and crude oil prices dropping significantly as safe-haven demand waned and geopolitical fears subsided.
- This week, investors will focus on key economic releases, including U.S. Non-Farm Payrolls, which could influence Federal Reserve policy decisions.
Live BTC/USD Chart
BTC/USD

0.0000
MARKETS TREND
Markets will watch a busy calendar this week with crucial inflation, labor, and PMI data from major economies as investors weigh recession risks, central bank paths, and growth momentum.
Markets Climb as Middle East Tensions Ease
Last week, global equity markets found support as signs of de-escalation emerged between Israel and Iran. U.S. stocks powered ahead, with both the S&P 500 and Nasdaq hitting fresh all-time highs. Investor sentiment improved as geopolitical fears moderated, helping maintain the market’s bullish momentum despite underlying economic uncertainties.
Mixed Signals from U.S. Economic Data
Friday’s release of the U.S. Personal Consumption Expenditures (PCE) data presented a nuanced challenge for Federal Reserve policymakers. Consumer spending showed signs of cooling, raising concerns about a potential stagflationary impulse even as core inflation remained elevated. This combination complicates the Fed’s policy path as it tries to balance growth risks with persistent price pressures.
Currency Markets React to Shifting Flows
Early in Friday’s session, the euro surged to a new three-year peak at 1.1750, helped by broad U.S. dollar selling. However, this move proved fleeting as the euro retreated to 1.1715 by the European close. Analysts suggested that quarter-end positioning and flow-driven USD buying contributed to the reversal, highlighting the impact of portfolio adjustments in thin markets.
Trump’s Trade Tweet Rattles Risk Assets
A late-session shock came as former President Trump declared an end to trade negotiations with Canada, reviving his “Tariff Man” persona. The move sent risk assets lower and sparked safe-haven demand for the dollar. USD/CAD jumped by around 70 pips as investors reassessed the threat of renewed trade friction.
Trump’s frustration centered on Canada’s long-planned digital services tax, scheduled to take effect on Monday. The tight timeline for implementation added a layer of weekend risk, fueling speculation about whether a last-minute compromise could be reached.
Commodities Under Pressure
Commodities saw notable declines heading into the weekend. Gold fell $44, down 1.31%, closing at $3,323.06 as safe-haven demand eased. Crude oil also dropped sharply by $3.50 to settle at $65.01, reflecting both profit-taking and the improved geopolitical outlook that reduced fears of supply disruptions.
Key Global Economic Data and Events to Watch This Week (1–5 July 2025)
This week is packed with high-impact economic releases that could set the tone for global markets in early July. Investors will focus on signs of cooling inflation in Europe, labor market resilience in the US, and China’s PMI signals for clues about the health of its recovery. The highlight will be Thursday’s US Non-Farm Payrolls, which could heavily influence expectations for Federal Reserve rate moves. Meanwhile, geopolitical risks and policy shifts will remain in the background, adding layers of complexity to market reactions.
Monday: 1 July
- Japan: May Industrial Production (important for gauging manufacturing health and global demand).
- China: Official NBS PMIs for June (critical signal on manufacturing and services trends in the world’s second-largest economy).
- Germany: May Retail Sales (consumer spending insights).
- Germany & Italy: Preliminary CPI for June (market focus on Eurozone inflation dynamics).
Tuesday: 2 July
- Japan: Q2 Tankan Large Manufacturers Index (key business confidence survey).
- China: Caixin Manufacturing PMI Final (June) – often diverges from official data, watched for private sector insights.
- Eurozone, UK, US: Final Manufacturing PMIs (June) – global industry health check.
- Germany: June Unemployment Rate (labor market tightness).
- Eurozone: Flash HICP for June (central for ECB policy expectations).
- US: ISM Manufacturing PMI for June – market-sensitive barometer of industrial momentum.
- Wednesday: 3 July
- Poland (NBP): Monetary Policy Announcement (rate decision, local EM focus).
- US: Challenger Job Cuts (June) – early labor-market signal.
- US: ADP Employment Report (June) – private-sector jobs precursor to NFP.
- Eurozone: Unemployment Rate (May) – headline labor data for the bloc.
Thursday: 4 July (US Independence Day, Early Close)
- China: Caixin Services PMI (June) – services momentum watch.
- Switzerland: June CPI (inflation signal for SNB policy).
- Eurozone, UK, US: Final Composite and Services PMIs (June) – broad economic health checks.
- US:
- Non-Farm Payrolls (NFP) for June – key labor-market release for Fed outlook.
- Weekly Initial Jobless Claims.
- ISM Services PMI (June) – critical for US growth trajectory.
- Factory Orders (May).
Friday: 5 July
- Switzerland: June Unemployment Rate.
- Germany: May Industrial Orders (manufacturing demand outlook).
- Eurozone: May Producer Prices (PPI) – pipeline inflation gauge.
Last week, markets were slower than what we’ve seen in recent months, with gold retreating as a result, the EUR/USD jumping above 1.16 but returned back below 1.15, while stock markets retreated on Friday. The moves weren’t too big though, and we opened 35 trading signals in total, finishing the week with 23 winning signals and 12 losing ones.
Gold Breaks Below the 50 Daily SMA for the First Time in A Year
Last week was particularly important from a technical standpoint. After briefly topping $3,500 per ounce in April 2025—a historic high—XAU/USD reversed hard, breaking below key chart levels. Notably, gold closed decisively below its 50-day simple moving average (SMA) on Friday, a support line that had reliably held for nearly a year.
This breach is a significant technical signal, suggesting a loss of upward momentum and opening the door to further declines. Traders are now eyeing the 100-day SMA around $3,150 as the next possible support, with a move below $3,000 no longer off the table if selling pressure persists.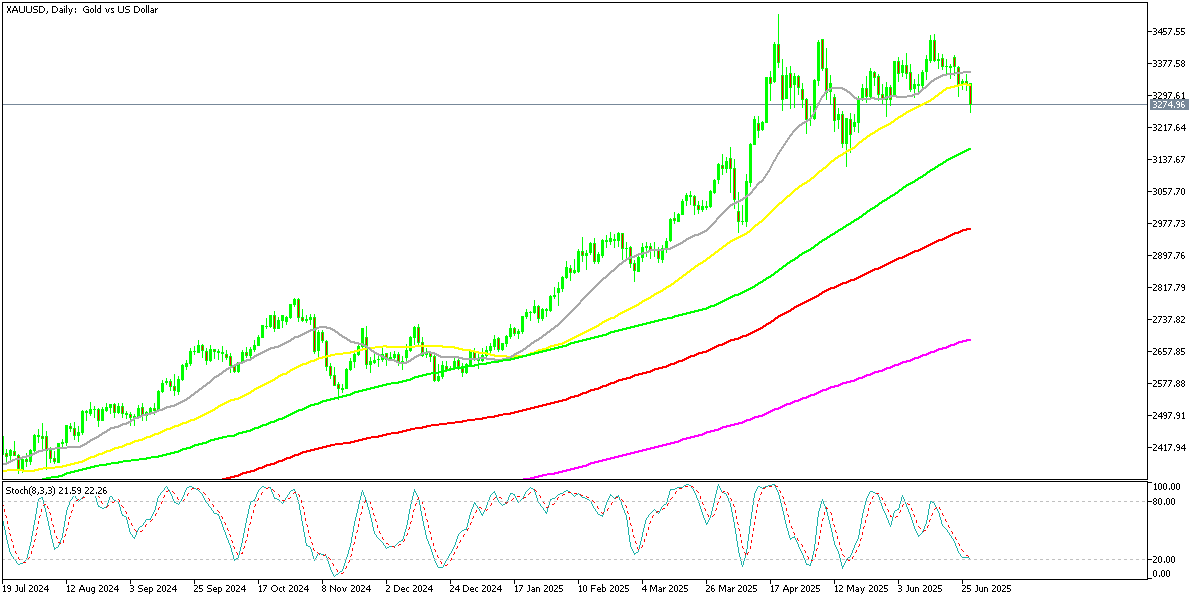
Yen Weakens Despite Rate Spread Expectations
The USD/JPY pair moved counter to expectations based on interest rate differentials, rising from 143.40 to 144.31. Analysts attributed this move more to capital outflows from Japan and global yield-chasing activity than to fundamental rate spread dynamics. Immediate support was seen near 142.70, with resistance around 145.00, suggesting that bigger moves may require a significant shift in overall risk sentiment.
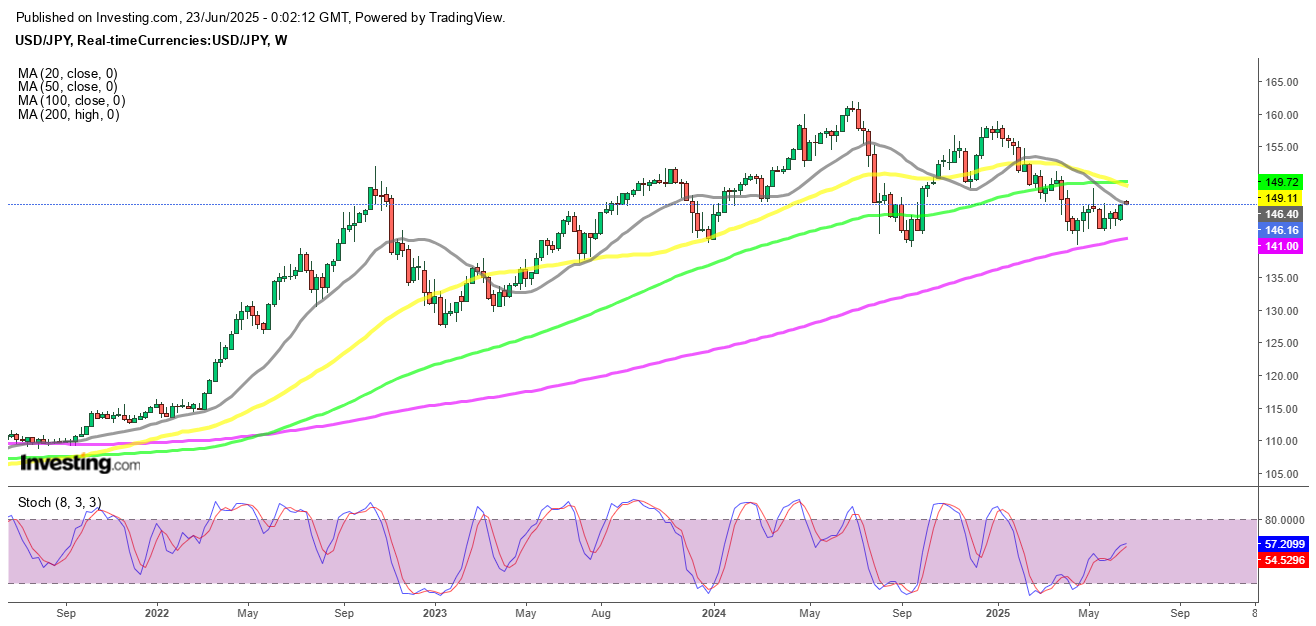
USD/JPY – Weekly Chart
Cryptocurrency Update
Bitcoin Tests Support Levels Before Bouncing
Bitcoin also faced selling pressure earlier in the week, breaking below its 50-day moving average near $104,000 and then slipping under $100,000 for the first time since early May. However, this dip was quickly seen as a buying opportunity by long-term investors. Buyers stepped in around the 20-week simple moving average (gray), lifting prices by roughly $10,000 to finish the week closer to $108,000, signaling ongoing confidence among committed holders.

BTC/USD – Weekly chart
Ethereum Outpaces Bitcoin Amid Technical Tailwinds
Ethereum (ETH) has outshone Bitcoin in recent weeks, rallying over 20% since April on institutional buying and excitement over the Pectra upgrade. The technical focus is now the 200-day moving average. A breakout above this level could open the path toward $4,000—potentially allowing ETH to outperform BTC through the summer.
ETH/USD – Daily Chart
On the commodity front, crude oil made a big reversal down and dropped $12 to close the week at $65.09, while gold lost $around 120 closing at $3,274.
Today’s Forex Market Events: Durable Goods Data Now in Spotlight
Today the US Final Q1 GDP is expected to remain unchanged at -0.2%, as are the Unemployment Claims at 244K. So attention shifts to Durable Good Orders.
Markets now turn to incoming economic data, particularly Durable Goods Orders:
- The consensus for headline durable goods m/m is +6.8%, reversing April’s -6.3% drop
- Core durable goods m/m are expected at +0.1%, slightly lower than the prior +0.2%
The expected spike in orders is driven largely by aircraft demand—Boeing reportedly received over 300 new orders in May. However, underlying demand outside transportation may remain weak.
Wells Fargo analysts suggest that the improvement excluding transportation may only be about 0.2%, reflecting tepid demand. Orders for core capital goods (excluding defense and aircraft) appear to be softening, potentially due to pre-tariff stockpiling and slowing corporate investment.
Looking ahead, capital expenditure is forecast to cool in Q2 as companies grapple with tight financial conditions, trade-related uncertainty, and a subdued business outlook. Investors will be watching nondefense capital goods shipments for confirmation.
Last week, markets were slower than what we’ve seen in recent months, with gold retreating as a result, the EUR/USD jumping above 1.16 but returned back below 1.15, while stock markets retreated on Friday. The moves weren’t too big though, and we opened 35 trading signals in total, finishing the week with 23 winning signals and 12 losing ones.
Gold Price Struggles Despite Global Tensions
Despite escalating geopolitical tensions, gold prices fell nearly 3% last week. After peaking at $3,500/oz in April, gold has pulled back and is now testing short-term support. Several doji candlesticks on the daily chart reflect market indecision. The 20- and 50-day moving averages are offering near-term stabilization.
A retest of $3,430–$3,450 is possible if geopolitical risks escalate. On the downside, a breach below $3,300 might signal markets are beginning to price in a long-term easing of global tensions.
USD/JPY Dips Amid Capital Flows, Not Fundamentals
The USD/JPY pair bucked the usual interest rate spread narrative. It fell from 143.40 to 144.31, largely due to capital outflows from Japan amid growing geopolitical risks and global yield-hunting behavior. Analysts suggest this movement was more flow-driven than fundamentally justified.
Immediate support is at 142.70, with key resistance at 145.00. Unless risk sentiment shifts significantly, larger moves may stall.
USD/JPY – Weekly Chart
Cryptocurrency Update
Bitcoin Slips Below $100K as Sentiment Sours
Bitcoin (BTC) has been under pressure, dropping below its 50-day moving average near $104,000 and then breaking below $100,000, a level not seen since early May. While long-term investors may see this as a buying opportunity, short-term traders are eyeing potential support levels at $90,000 or even April lows near $74,000.
BTC/USD – Weekly chart
Ethereum Outpaces Bitcoin Amid Technical Tailwinds
Ethereum (ETH) has outshone Bitcoin in recent weeks, rallying over 20% since April on institutional buying and excitement over the Pectra upgrade. The technical focus is now the 200-day moving average. A breakout above this level could open the path toward $4,000—potentially allowing ETH to outperform BTC through the summer.
ETH/USD – Daily Chart
- Check out our free forex signals
- Follow the top economic events on FX Leaders economic calendar
- Trade better, discover more Forex Trading Strategies
- Open a FREE Trading Account
- Read our latest reviews on: Avatrade, Exness, HFM and XM
ABOUT THE AUTHOR
See More
Skerdian Meta
Lead Analyst
Skerdian Meta Lead Analyst.
Skerdian is a professional Forex trader and a market analyst. He has been actively engaged in market analysis for the past 11 years. Before becoming our head analyst, Skerdian served as a trader and market analyst in Saxo Bank's local branch, Aksioner. Skerdian specialized in experimenting with developing models and hands-on trading. Skerdian has a masters degree in finance and investment.
Related Articles


Sidebar rates
Related Posts
