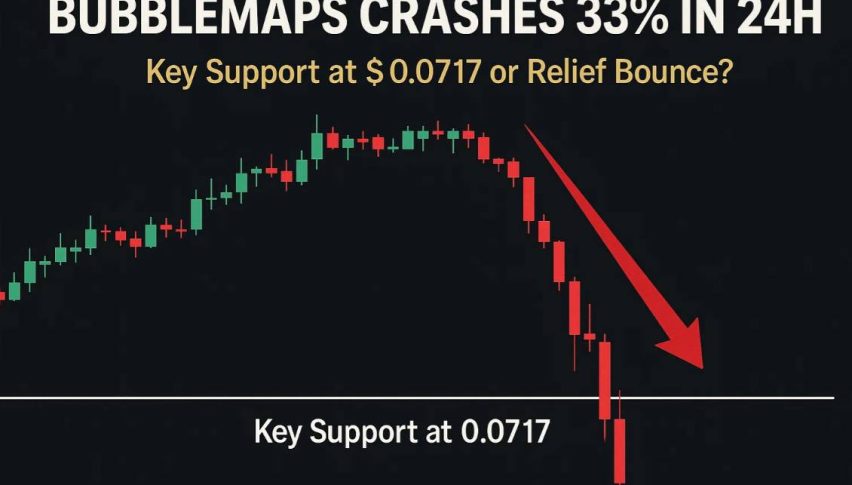
Bubblemaps Crashes 33% in 24H—Key Support at $0.0717 or Relief Bounce?
Bubblemaps plunges 33% after trendline break and Fibonacci failure. Is a bounce near $0.085 or will bears drive BMT toward $0.0717?
Quick overview
- Bubblemaps (BMT) experienced a 33% drop in 24 hours, falling to $0.0876 after breaking key support levels.
- The 4-hour chart indicates capitulation with significant selling pressure and failure to hold Fibonacci levels.
- Current support zones include $0.0837, $0.0773, and $0.0717, while resistance is at $0.0949 and $0.1018.
- Traders are advised to watch for a potential long opportunity between $0.085 and $0.088 if a bullish reversal candle appears.
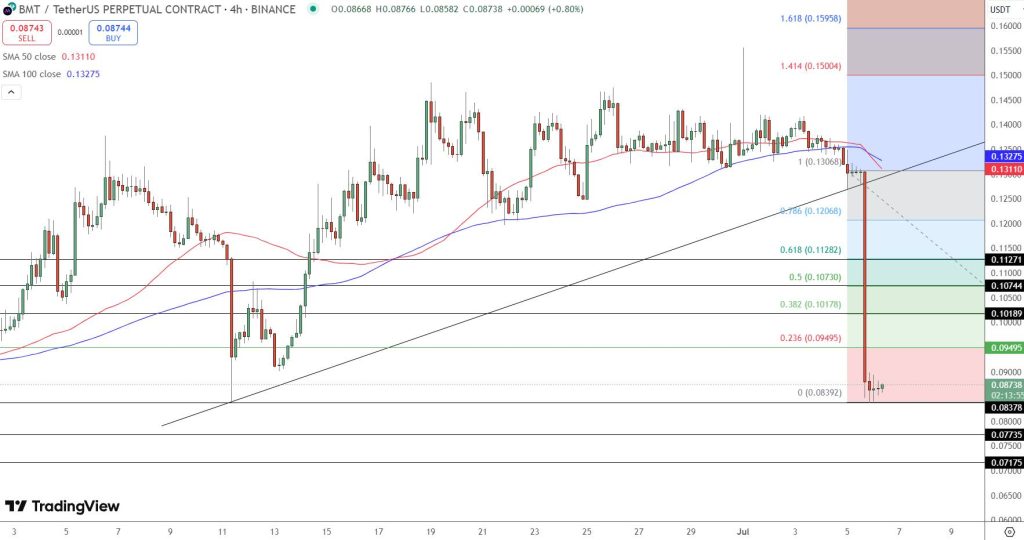
Bubblemaps (BMT) has gone into damage control mode after a 33% drop in 24 hours. The selloff was triggered by a break below the long-term ascending trendline and the 50-day simple moving average, which has been supporting since mid-June. BMT is now at $0.0876, its lowest in a month.
The 4-hour chart tells the story: a big red candle, no lower wick, follow-through selling. This is capitulation. Compounding the pressure was a failure to hold key Fibonacci levels. The 0.618 level at $0.1128 and 0.5 at $0.1073 were both sliced through with ease.
Bubblemaps (BMT) Support Zones and Recovery Risks
At a psychological level of $0.085, BMT is showing some hesitation. A cluster of spinning tops and doji candles suggests bears are still in control but downside momentum may be slowing.
Support zones to watch:
- $0.0837: Current floor being tested
- $0.0773: Next support with history
- $0.0717: Final base if selling resumes
Resistance on the upside:
- $0.0949: Immediate bounce target
- $0.1018: Higher resistance tied to failed Fibonacci support
- 50-SMA: Now above at $0.1311, long term ceiling
Bubblemaps (BMT) Trade Setup: Rebound or More Pain?
Technically, BMT is bearish until it gets back above $0.0949. But this area between $0.085 and $0.088 could be a tactical long opportunity if a clear reversal candle appears, such as a hammer or bullish engulfing, confirmed by volume.
Setup:
- Entry (Long): $0.085-$0.088 with bullish candle + volume
- Targets: $0.0949 → $0.1018
- Stop-Loss: Below $0.083
- Trend Bias: Bearish until above $0.0949+
Altcoin traders, this could be a low risk bounce or more pain if $0.0837 breaks. Either way, BMT will set the tone for short-term altcoin sentiment.
- Check out our free forex signals
- Follow the top economic events on FX Leaders economic calendar
- Trade better, discover more Forex Trading Strategies
- Open a FREE Trading Account
- Read our latest reviews on: Avatrade, Exness, HFM and XM
Related Articles


Sidebar rates
Related Posts
