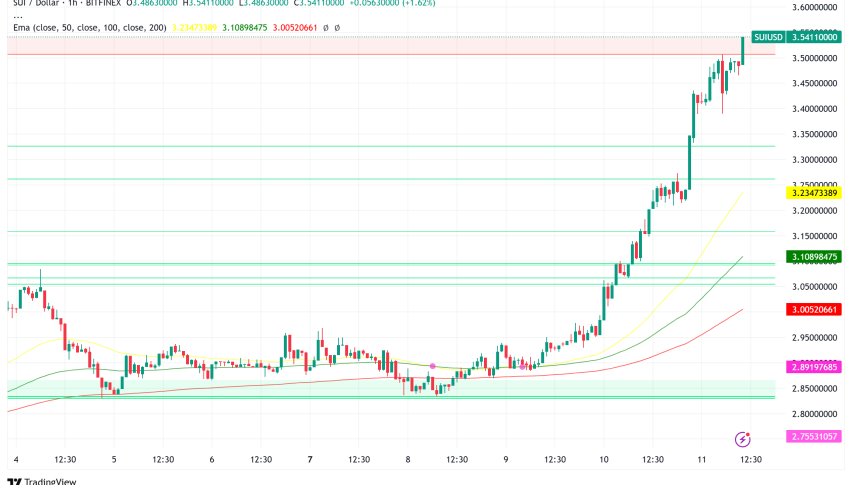
SUI Surges 17% Above $3.50, Bullish Technical Pattern Signals Rally to $3.89
Sui (SUI) has been one of the best performers in the recent crypto market surge. It is now trading above $3.50 and has gained more than 17%
Quick overview
- Sui (SUI) has surged over 17% in the last 24 hours, trading above $3.50 after breaking out of an inverse head-and-shoulders pattern.
- The recent price movement is supported by strong technical indicators, including a recovery above key moving averages and a positive relative strength index (RSI).
- Sui's ecosystem is bolstered by the successful integration of tBTC, enhancing its DeFi capabilities and attracting significant user interest.
- While the outlook remains bullish with a target of $3.89, traders should remain cautious due to potential short-term overbought conditions.
Sui (SUI) has been one of the best performers in the recent crypto market surge. It is now trading above $3.50 and has gained more than 17% in the last 24 hours. The Sui Network’s native token has successfully broken out of a classic inverse head-and-shoulders pattern. This could lead to a rally toward the $3.89 technical goal.

The breakout happened as the cryptocurrency market got stronger again, thanks to Bitcoin’s rise to new all-time highs above $118,000. This positive mood has made things better for certain altcoins, and SUI is taking advantage of the momentum with good technical fundamentals.
SUI/USD Technical Analysis Reveals Strong Bullish Signals
The price movement of SUI has confirmed a number of important technical changes that support the bullish view. The token made a quick recovery from the 20-day exponential moving average (EMA) at $2.92 and broke above the 50-day simple moving average (SMA) at $3.08, finishing the inverse head-and-shoulders pattern.
Technical indicators are coming together to support the upward trend. The 20-day EMA is trying to go higher, and the relative strength index (RSI) has gone into positive territory, which means that both institutional and retail traders are starting to purchase again. If bulls can keep the price above the important 50-day SMA level, the SUI/USD pair can first aim for $3.55 before moving on to the pattern target of $3.89.
The inverse head-and-shoulders pattern, which is one of the most dependable reversal patterns in technical analysis, shows that the recent selling pressure has been absorbed and buyers are regaining control. The neckline at $3.08 is now a key support level. If the price stays above this level, it will reaffirm the bullish bias.
Short-Term Caution Amid Overbought Conditions
Even though the technical picture is mostly good, traders should be careful in the short term. The RSI on the 4-hour chart shows that SUI may have a short-term decline because it is overbought. This means that the overall trend is still positive, but there may be some consolidation or a small pullback before the next leg up.
The neckline at $3.08 and the 20-day EMA at $2.92 are two important support levels to keep an eye on. If the price bounces off these levels, it will support the bullish thesis and make it more likely that the $3.89 objective will be reached. If the price can’t stay above the 20-day EMA and falls below the moving averages, SUI might go back to $2.80 and maybe even drop to $2.60, which would make the current bullish position useless.
Sui Ecosystem Developments Drive Fundamental Strength
SUI’s recent price rise is due to more than just technical issues; there have also been major changes in the ecosystem. The addition of tBTC (Threshold Network’s synthetic bitcoin) to the Sui Network is a big step forward. It makes Sui the first non-EVM chain to enable native tBTC minting. This change makes the network’s DeFi features better and gives users new ways to earn interest and borrow against their bitcoin holdings.
The tBTC launch on Sui has already seen a lot of use, with almost $1 million in Total Value Locked (TVL) on Bluefin inside the first 24 hours. This early success shows that a lot of people want to utilize bitcoin in Sui’s high-performance DeFi environment, which can process transactions as quickly as 400 milliseconds.
Sui Price Prediction and Market Outlook
SUI looks like it will keep going higher based on the current technical setup and fundamental changes. The immediate goal is still $3.89, which is the measured move from the inverse head-and-shoulders pattern. If this level is broken, there might be more gains toward $4.00 and higher.
Investors should still be aware of the bigger picture and how the market can change. Because the cryptocurrency market is linked to how well Bitcoin does, any big drop in the price of the main digital asset could affect SUI’s path. Also, the fact that the market is overbought on shorter timeframes means that some consolidation may be needed before the next big move up.
The fact that tBTC has been successfully integrated and that DeFi activity is developing on the Sui Network are both significant reasons to believe that the token is worth what it is. SUI’s long-term prospects are still quite good as the ecosystem grows and attracts more users. This makes the current technical breakout very important for both short-term traders and long-term investors.
- Check out our free forex signals
- Follow the top economic events on FX Leaders economic calendar
- Trade better, discover more Forex Trading Strategies
- Open a FREE Trading Account
- Read our latest reviews on: Avatrade, Exness, HFM and XM
Related Articles

Sidebar rates
Related Posts
