Ripple: XRP Faces imminent correction after Record High
XRP appears to be forming a falling star candlestick pattern after one of the most aggressive rallies among major altcoins.

Quick overview
- XRP is forming a falling star candlestick pattern, indicating a potential short-term bearish reversal after a significant rally.
- The price reached approximately $3.70 before selling pressure caused a decline, leaving a tall wick and suggesting buying enthusiasm may be waning.
- Despite recent gains, the Relative Strength Index (RSI) has surged past 70, indicating an overbought condition, but this may not signal an immediate decline.
- The weekly chart shows strong bullish momentum, with historical data suggesting that overbought conditions can persist during solid growth.
Live XRP/USD Chart
XRP appears to be forming a falling star candlestick pattern after one of the most aggressive rallies among major altcoins. This pattern is a crucial technical indicator that often predicts short-term reversals and intraday rejections at higher price levels.

XRP is attempting to create a daily candle that will complete the falling star, characterized by a long upper wick, a thin body, and little to no lower shadow. This pattern suggests an upcoming bearish reversal, especially if it is followed by a red candle and declining volume, which are common after a sustained bullish move.
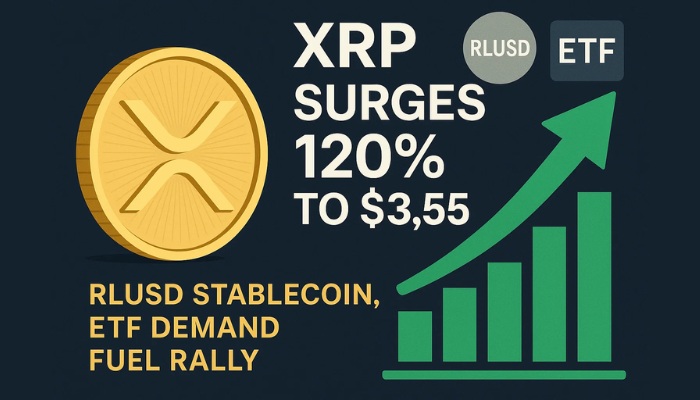
XRP reached a price of approximately $3.70, but selling pressure soon emerged, erasing most of the gains and leaving behind a tall wick. Bulls are facing downward pressure, indicating that buying enthusiasm may be reaching its limit. XRP is still significantly up for the week, and at the time of writing, it is priced at $3.45.
Additionally, the Relative Strength Index (RSI) has surged past 70 and now stands at 88. XRP hit $3.66 this week, surpassing its 2018 all-time high of $3.40. The weekly chart, which smooths out daily fluctuations over several months, the technical outlook for XRP appears strong enough to suggest continuation.
The weekly RSI near 70 indicates an overbought condition.
While this may raise concerns for day traders, it tells a different story over longer periods. On weekly charts, RSI levels above 70 often indicate strong bullish momentum rather than imminent sharp declines. Historical data shows that assets can remain “overbought” for several weeks during solid growth, which is a positive sign for long-term investors. Currently, XRP scores 19 on the Average Directional Index (ADX) weekly chart, generally indicating a weak trend.
However, this can be misleading, as ADX measures trend strength on a scale from 0 to 100. Although levels below 25 typically suggest weak trends, the overall context is important.
- Check out our free forex signals
- Follow the top economic events on FX Leaders economic calendar
- Trade better, discover more Forex Trading Strategies
- Open a FREE Trading Account


