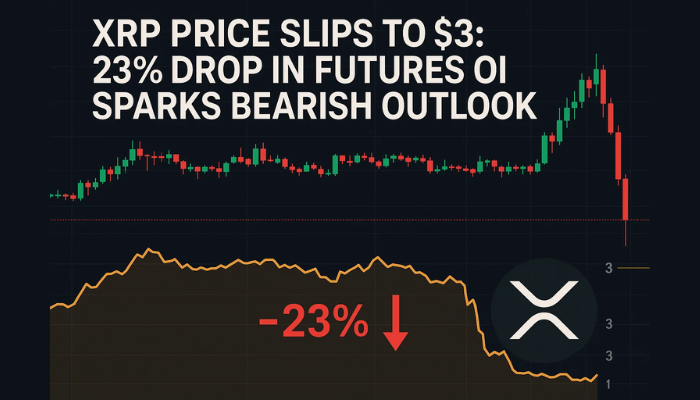
XRP Price Slips to $3: 23% Drop in Futures OI Sparks Bearish Outlook
Ripple’s XRP is under pressure this week, trading at $3.09 as of Thursday after failing to break above $3.32...
Quick overview
- Ripple's XRP is currently trading at $3.09, facing pressure after failing to surpass $3.32 amid a hawkish Fed stance and impending tariff deadlines.
- Retail demand for XRP has decreased, reflecting broader investor caution due to uncertainties in US trade policy and unresolved negotiations with China.
- Technical indicators show a bearish bias for XRP, with momentum weakening and a potential move below $3.00 threatening further corrections.
- Traders are bracing for increased volatility this weekend, with the possibility of reclaiming $3.32 to restore bullish momentum.
Ripple’s XRP is under pressure this week, trading at $3.09 as of Thursday after failing to break above $3.32. The pullback comes after the Fed’s hawkish stance and the looming tariff deadline which is set to reshape global trade starting Friday.
Fed Chair Jerome Powell said they will wait and see on interest rate hikes, and need to monitor inflation and labor data. This ambiguity has caused caution across risk markets including cryptos. Retail demand for XRP has cooled off, reflecting broader investor hesitation.
XRP Investors React to Trade & Tariff Concerns
Markets are watching US trade policy as the White House nears a deadline. Higher tariffs will hit exports from countries without deals by Friday. As of Thursday, only 8 deals have been made out of 200, per CNBC, though one big deal with the EU was made this week.
Trade talks with China are still unresolved. Negotiations in Stockholm recently ended with no breakthrough and with the current truce expiring August 12, the stakes are high. Historically, such geopolitical events have caused increased volatility in digital assets like XRP.
Technical Indicators Suggest Bearish Bias for XRP
The technicals are weakening for XRP. Despite holding $3.00 support, the momentum indicators are bearish.
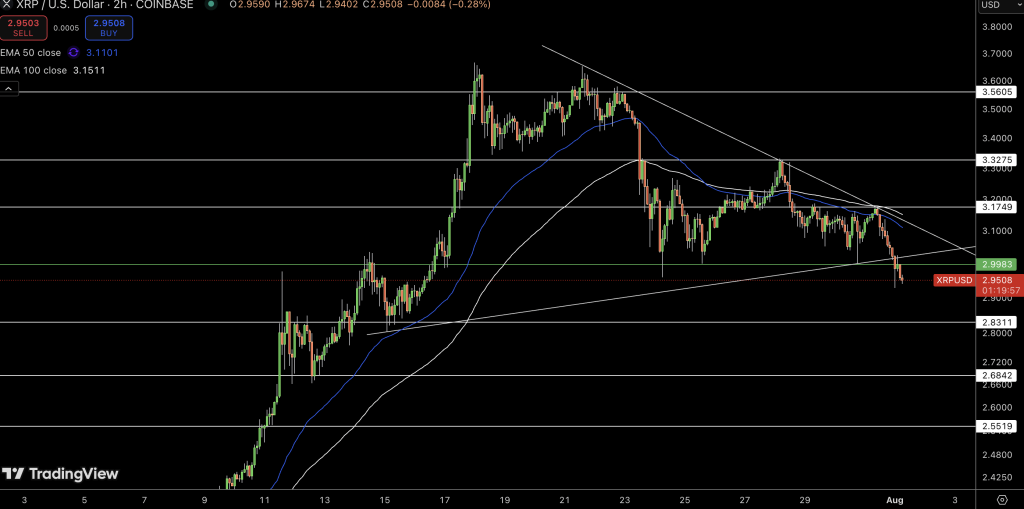
- MACD: Bearish crossover with the blue line below the signal line
- RSI: Dropping towards the midline, indicating waning buying pressure
- Futures Open Interest: Fell 23% to $8.4 billion from $10.94 billion (July 22)
- 50-Day EMA: At $2.77, ready to offer support
With leveraged longs decreasing, XRP’s ability to hold the uptrend is in question. A move below $3.00 could expose the token to a deeper correction to $2.95, with the $2.77 EMA as the floor.
But if bulls can hold, reclaiming $3.32 and pushing to $3.66 could restore the bullish momentum. But for now, traders are preparing for more volatility this weekend.
- Check out our free forex signals
- Follow the top economic events on FX Leaders economic calendar
- Trade better, discover more Forex Trading Strategies
- Open a FREE Trading Account
