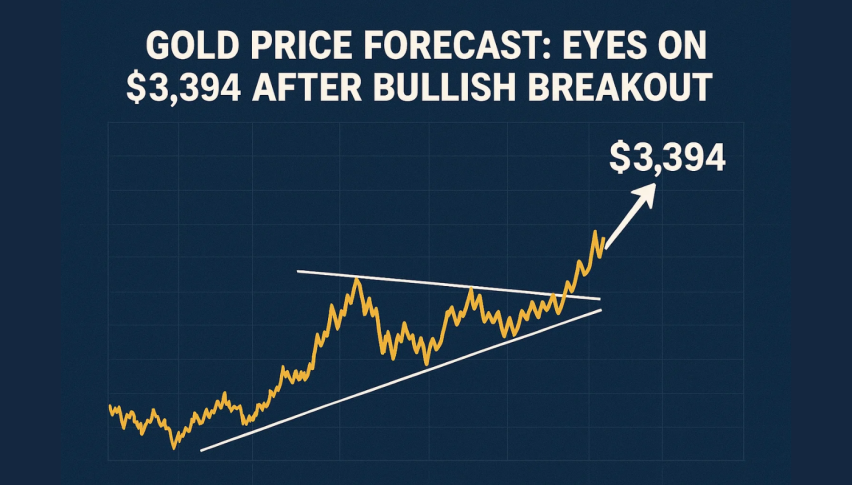
Gold Price Forecast: Eyes on $3,394 After Bullish Breakout
Gold surged on Monday after a big breakout from a descending channel, closing at $3,363 after hitting an intraday high of $3,363.60.
Quick overview
- Gold prices surged to $3,363 after breaking out of a descending channel, driven by disappointing US Non-Farm Payroll data.
- The price action indicates bullish momentum, with key resistance levels at $3,394, $3,439, and $3,472.
- A clean break above $3,363 could accelerate gains, while a rejection may lead to a pullback towards $3,342-$3,346.
- Economic events and Fed speeches today could further influence gold's price movement.
Gold surged on Monday after a big breakout from a descending channel, closing at $3,363 after hitting an intraday high of $3,363.60. The move was triggered by weak US Non-Farm Payroll (NFP) data which came in at 73,000 jobs vs 106,000 expected. The miss killed rate hike expectations and weakened the dollar and pushed safe-haven assets like gold higher.
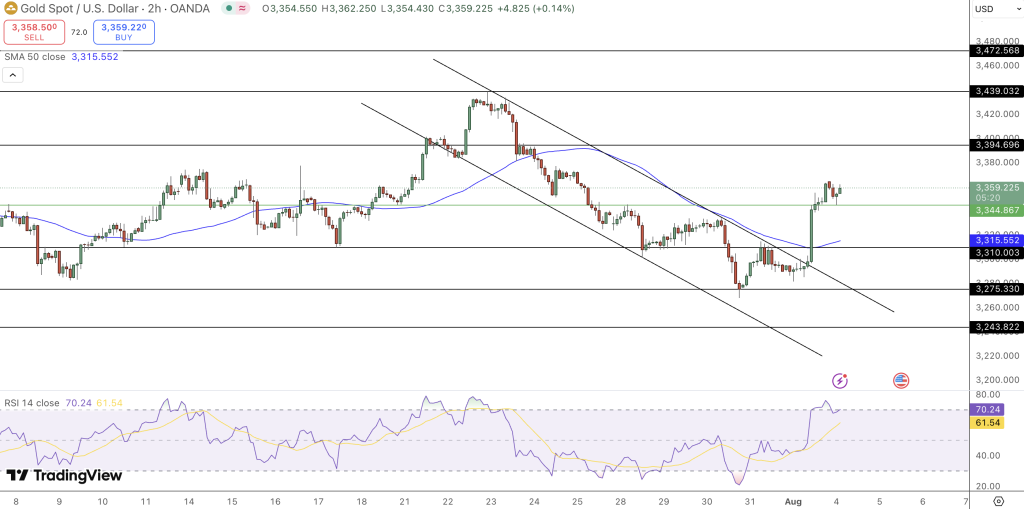
On the 4-hour chart, gold broke above the 50-period Simple Moving Average at $3,342 which had been capping upside for some time. Price also took out horizontal resistance at $3,346 and that zone is now support. With momentum firmly in the bulls’ favour, we are now looking for a continuation to the next resistance at $3,394.
Key Resistance Levels
Technically the bullish structure is still intact. Price is above the 50-SMA and making higher highs. The Relative Strength Index (RSI) is at 65.69 just below overbought so more upside is possible but a pause or pullback may be healthy.
If bulls are in control the next resistance levels to watch are:
- $3,394 – Previous swing high from July 24
- $3,439 – Mid-July resistance zone
- $3,472 – Key psychological and technical barrier
But failure to build on Friday’s move could see consolidation or a minor correction. A retest of $3,346-$3,342 would be a healthy dip for new buyers to get in before the next leg up.
Intraday Trade Scenarios and Outlook
Gold’s setup heading into Monday is bullish but price action around $3,363 will be key. A clean break above this level with volume could accelerate gains, rejection could drag price back to support.
Here’s how to trade today:
- Bullish Setup: Buy on break and hold above $3,363, target $3,394 and $3,439
- Pullback Entry: Buy near $3,342-$3,346 zone with stop under $3,310
- Bearish Setup: Short on bearish reversal candle near $3,363, target $3,310 and $3,275
Today’s Economic Events* 14:00 GMT: ISM Services PMI – A good number could bring back rate hike hopes
- Fed Speakers: Collins and Cook speeches to impact USD
Bottom Line: As long as gold is above $3,342, it’s higher. Watch $3,394 for a breakout or exhaustion.
- Check out our free forex signals
- Follow the top economic events on FX Leaders economic calendar
- Trade better, discover more Forex Trading Strategies
- Open a FREE Trading Account
- Read our latest reviews on: Avatrade, Exness, HFM and XM
Related Articles


Sidebar rates
Related Posts
