Toncoin Eyes 20% Breakout Above $3.42 – Golden Cross & Coinbase Buzz
Toncoin (TON) has been consolidating but recent developments could change that. Coinbase Ventures has joined the list of backers...
Quick overview
- Toncoin (TON) is experiencing consolidation, but recent backing from Coinbase Ventures has sparked market excitement.
- Long positions have increased, indicating trader optimism for a potential upside breakout after a recent price increase.
- Technical analysis shows TON is forming higher lows while facing strong resistance at $3.42, suggesting a tightening setup that may precede a breakout.
- Traders are advised to watch for a close above $3.42 to target higher price levels, while maintaining stop-loss orders to manage risk.
Toncoin (TON) has been consolidating but recent developments could change that. Coinbase Ventures has joined the list of backers – along with Sequoia Capital and Ribbit Capital – and that’s given the market a boost. We don’t know how many TON tokens they bought but the fact alone has got the market excited.
According to CoinGlass data, long positions have increased to 50.43% from 48.71% in the last 24 hours. Traders are expecting an upside breakout after last week’s 3.5% move higher which brought TON closer to retesting the resistance levels.
TON Technical Picture: Higher Lows Meet Strong Resistance
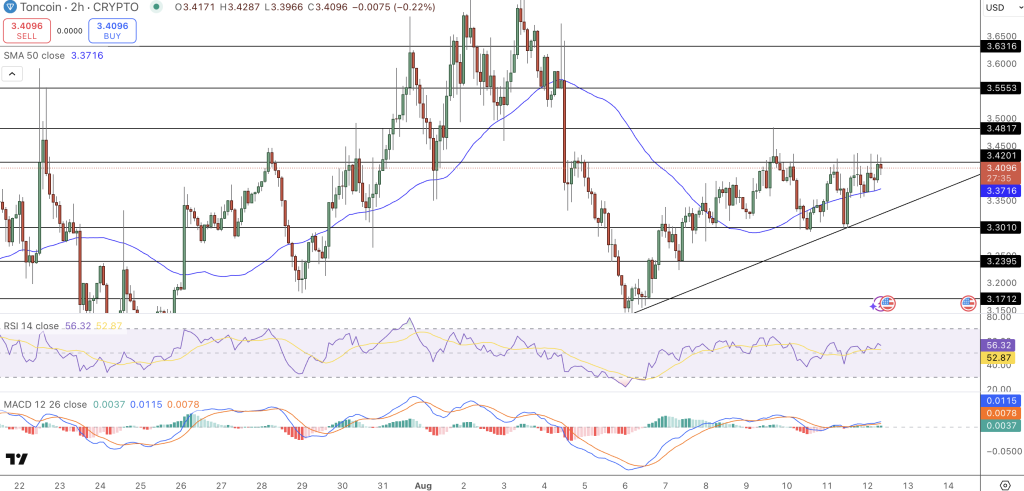
On the 2-hour chart, TON is respecting the ascending trendline from the August 7 low and forming a sequence of higher lows – a bullish sign. Price is being capped by the horizontal resistance at $3.42 which has rejected multiple attempts to break higher over the last week. This confluence of rising support and flat resistance is a tightening setup that often precedes a breakout.
The 50-EMA at $3.37 has acted as support and has been repeatedly rejected – suggesting dip buying. The 50-day and 100-day EMAs are closing in on a Golden Cross – a setup many traders consider a precursor to a strong uptrend.
Candlestick analysis shows multiple small bodied candles with upper wicks near resistance – spinning tops – which indicates short term indecision before a move.
Momentum indicators are bullish. RSI is at 56 and not overbought. MACD is positive and the histogram is expanding – suggesting momentum could accelerate if price breaks resistance.
Key Levels and Trade Setup
For traders:
- Breakout Trigger: A 2-hour close above $3.42 could target $3.48 initially and then $3.55.
- Stop-Loss: Below $3.37 (50-EMA) to protect against false breakouts.
- Downside Risk: If the trendline support fails TON could drop to $3.30 and then $3.23.Volume confirmation required. Newbies enter after the breakout/breakdown.
Toncoin’s near-term trajectory hinges on whether bulls can reclaim control above $3.42. With institutional interest adding a layer of credibility and multiple technical signals aligning, the balance tilts toward cautious optimism. For now, TON remains firmly on the watchlist for traders eyeing a potential 20% upside move.
- Check out our free forex signals
- Follow the top economic events on FX Leaders economic calendar
- Trade better, discover more Forex Trading Strategies
- Open a FREE Trading Account
- Read our latest reviews on: Avatrade, Exness, HFM and XM
Related Articles


Sidebar rates
Related Posts
