Ethereum’s Institutional Demand Wavers Amid New Derivatives Expansion
Ethereum (ETH) is at a turning point right now. The cryptocurrency has been stable around $4,300, but underlying market conditions show that
Quick overview
- Ethereum is currently stable around $4,300 but is experiencing significant outflows from ETFs, indicating reduced institutional interest.
- The cryptocurrency is in a consolidation phase, trading between $4,232 and $4,488, with key resistance at $4,340 and $4,385.
- Future price movements depend on breaking the $4,385 resistance, which could lead to a rise towards $4,550, while failure to hold above $4,232 may result in a drop to $4,096.
- Despite current challenges, the expansion of the derivatives market suggests potential long-term optimism for Ethereum.
Ethereum ETH/USD is at a turning point right now. The cryptocurrency has been stable around $4,300, but underlying market conditions show that institutions are becoming less willing to invest. Recent data shows that investors are feeling very differently about Ethereum. On Friday, Ethereum exchange-traded funds (ETFs) saw their second-largest single-day outflow since they started, with 104,100 ETH worth around $447 million leaving the funds.
The price action right now is part of a larger consolidation pattern that has been going on for the last 12 days. Ethereum has been trading aimlessly between $4,232 and $4,488 since late August. This shows that the market is unsure of what to do because institutional flows have dropped sharply from earlier highs.
ETH/USD Technical Analysis: Range-Bound Trading with Breakout Potential
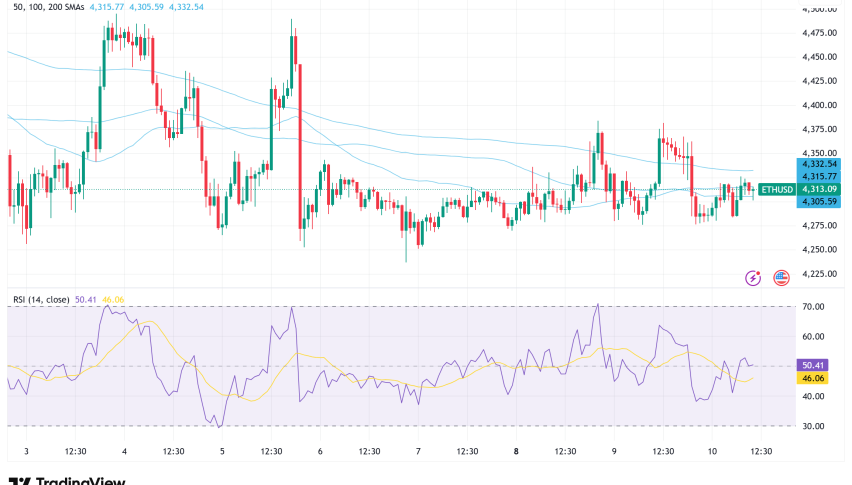
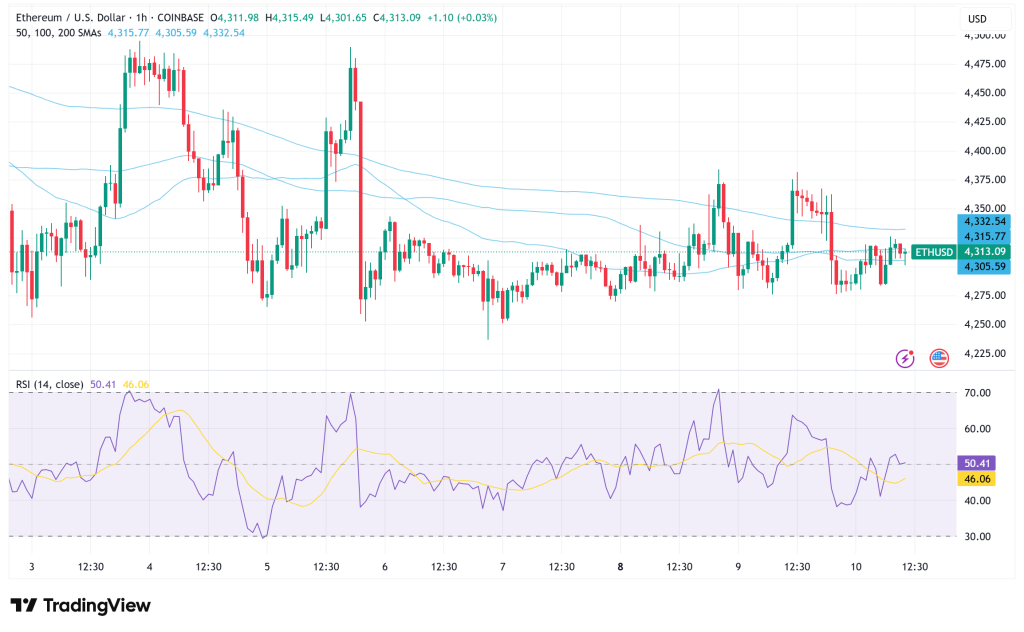
From a technical point of view, Ethereum’s price structure shows that it is in a consolidation period after falling from the $4,387 swing high. The cryptocurrency has found support above the $4,260 mark, and there are important resistance levels at $4,340 and $4,385.
A bearish trend line is now holding the price at $4,340 on the hourly chart. The Relative Strength Index (RSI) is also hovering near the neutral 50 level on daily timeframes, which shows that traders are still unsure of what to do. The 100-hourly Simple Moving Average adds more resistance, as ETH is trading below this technical indicator.
Ethereum needs to clearly break through the $4,385 barrier level for bullish momentum to start up again. Prices might rise to the $4,420–$4,500 region if this breakthrough happens, and they could even go as high as $4,550 in the near future. But if it doesn’t break over the current resistance levels, it could fall to the $4,220–$4,200 support zone.
Derivatives Market Expansion Offers Long-Term Optimism
Even though there are problems right now, big changes in the derivatives market show that institutions are becoming more accepting. Cboe Global Markets wants to start offering 10-year Bitcoin and Ethereum futures contracts on November 10, but they need permission from the government first. These “continuous futures” will work like perpetual contracts that are common in decentralized finance. They will make it easier for institutional traders to manage their positions.
The fact that this regulatory permission happened shows that the current U.S. administration is more open to crypto derivatives products than previous ones. Bitnomial and Coinbase both launched perpetual futures contracts early this year, so this move comes after that.
Ethereum Price Prediction: Cautious Optimism with Key Levels to Watch
Ethereum looks like it will keep trading in a range for the time being, based on both technical and fundamental analysis. The $4,232-$4,488 range that was set up over the past two weeks is probably still important. The direction of the cryptocurrency will depend on institutional ETF flows and the mood of the market as a whole.
If the price stays above $4,488 for a long time, it could start to go toward the previous all-time high of $4,956, which would be around 15% higher. The new derivatives products and possible renewed interest from institutions might be the spark that sets off such a move.
Bearish Scenario: If support doesn’t stay above $4,232, the price might keep going down to the 50-day exponential moving average at $4,096, which would be a 5% drop from where it is now.
- Check out our free forex signals
- Follow the top economic events on FX Leaders economic calendar
- Trade better, discover more Forex Trading Strategies
- Open a FREE Trading Account
- Read our latest reviews on: Avatrade, Exness, HFM and XM
Related Articles


Sidebar rates
Related Posts
Ava

