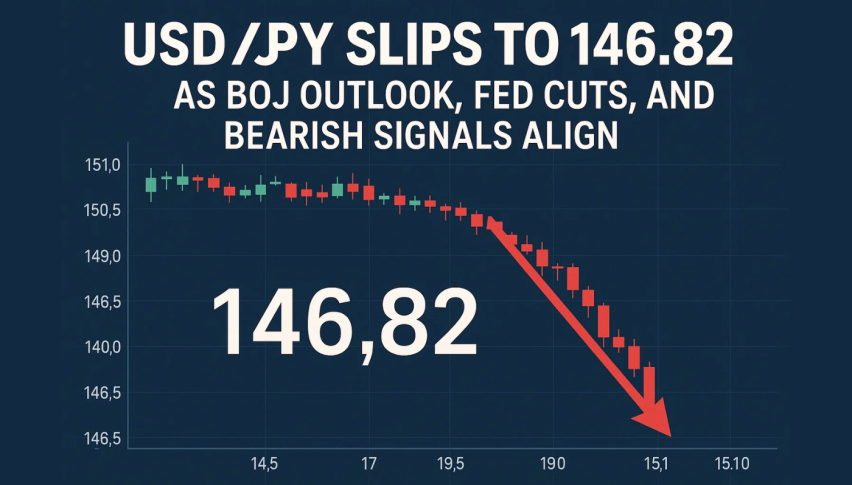
USD/JPY Slips to 146.82 as BoJ Outlook, Fed Cuts, and Bearish Signals Align
USD/JPY dipped below 147.00 during Asian hours as the yen continued to rally as investors weigh the diverging policy paths...
Quick overview
- USD/JPY fell below 147.00 as the yen strengthened amid diverging monetary policies between the BoJ and the Fed.
- Political uncertainty in Japan, particularly following Prime Minister Shigeru Ishiba's resignation, is contributing to market volatility.
- The dollar is pressured by soft U.S. data and expectations of multiple Fed rate cuts in 2025, with traders awaiting the Fed's decision.
- Technically, USD/JPY shows bearish signals, with key support levels at 146.59 and 146.00, and resistance at 147.14 and 147.55.
USD/JPY dipped below 147.00 during Asian hours as the yen continued to rally as investors weigh the diverging policy paths of the Bank of Japan (BoJ) and the U.S. Federal Reserve (Fed). The dollar hit its weakest level since late July as the market is increasingly convinced the Fed will ease while the BoJ will continue to normalize.
Political uncertainty in Tokyo also added to the volatility. Prime Minister Shigeru Ishiba’s resignation has raised doubts on the pace of reforms and Shinjiro Koizumi’s candidacy for LDP leadership is a wild card for future BoJ decisions. Investors are cautious ahead of this week’s central bank meetings.
Fed Pressure Weighs on Dollar
The dollar is under pressure from soft U.S. data and growing expectations of multiple Fed rate cuts in 2025. Markets are pricing in up to three 25-bp cuts and traders are waiting for Wednesday’s Fed decision. The Senate’s confirmation of Stephen Miran to the Fed’s board and the uncertainty around Governor Lisa Cook’s role also highlight the institutional changes that will impact policy.
The weakening U.S. Dollar Index (DXY) reflects this shift as traders wait for Powell’s guidance on whether the easing cycle will accelerate into year-end.
USD/JPY Technical Setup Points to Downside
Technically, USD/JPY is struggling at 146.82 after being rejected at 147.55 50-SMA. A series of lower highs since early September indicates sustained bearish pressure and the descending trendline is capping the recovery.
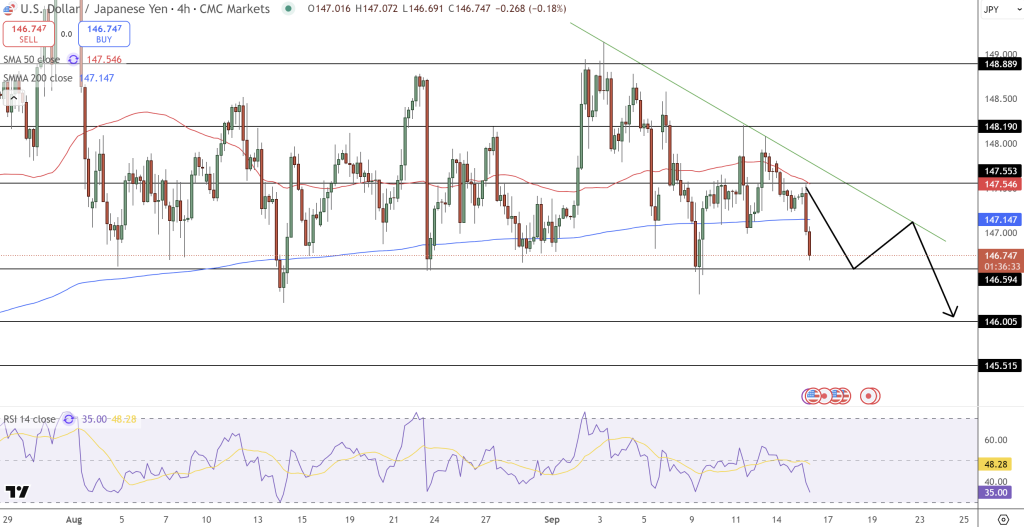
Candlestick analysis shows multiple long upper wicks, sign of selling at resistance. The drop below 147.14 200-SMA flipped the previous support into resistance and the RSI is at 36, not oversold yet.
Key levels to watch:
- Support: 146.59, 146.00 and 145.51 (tested multiple times in August)
- Resistance: 147.14 and 147.55
Trade Setup:
- Entry: Short below 146.59
- Stop-loss: Above 147.20
- Targets: 146.00 first, then 145.51 if momentum extends
- Wait for a retest of 147.20 for a shorter entry.
- Check out our free forex signals
- Follow the top economic events on FX Leaders economic calendar
- Trade better, discover more Forex Trading Strategies
- Open a FREE Trading Account
- Read our latest reviews on: Avatrade, Exness, HFM and XM
Related Articles


Sidebar rates
Related Posts
