Dogecoin Surges Past $0.26: Whale Accumulation and Technical Patterns Signal Potential 75% Rally
Dogecoin (DOGE) is now worth more than $0.26, which is a 5.1% increase in the last 24 hours and a 15% recovery from previous support levels
Quick overview
- Dogecoin (DOGE) has increased by 5.1% in the last 24 hours, reaching over $0.26, with signs of a potential breakout.
- Whale accumulation is driving a supply shock, with significant purchases and a decrease in coins on exchanges.
- Technical analysis indicates critical resistance at the $0.2626 Fibonacci level, with potential targets up to $0.34 if momentum builds.
- Long-term trends suggest a possible rise to $1, supported by macroeconomic factors and historical price patterns.
Dogecoin DOGE/USD is now worth more than $0.26, which is a 5.1% increase in the last 24 hours and a 15% recovery from previous support levels. The top meme cryptocurrency is getting a lot of attention again because a lot of technical indicators, on-chain data, and historical cycle patterns are all pointing to a big breakout that could happen soon.
Whale Accumulation Drives DOGE Supply Shock
A lot of whales have been buying DOGE tokens, which has helped the recent increase. In just 24 hours, huge holders have bought almost 30 million DOGE tokens. This intense buying is happening at the same time as more than $25 million leaving exchanges, which means that coins are going into cold storage instead of being prepped for sale.
Data on the blockchain shows a positive supply dynamic. The Spent Coins Age Band has declined a lot, which means that fewer dormant coins are being transferred even while values are going up. This is a sign of early-stage uptrends. HODL Waves data shows that more and more short- and long-term holders are getting involved, which suggests that conviction is growing. As demand grows, the tightening supply situation makes it more likely that prices will go higher.
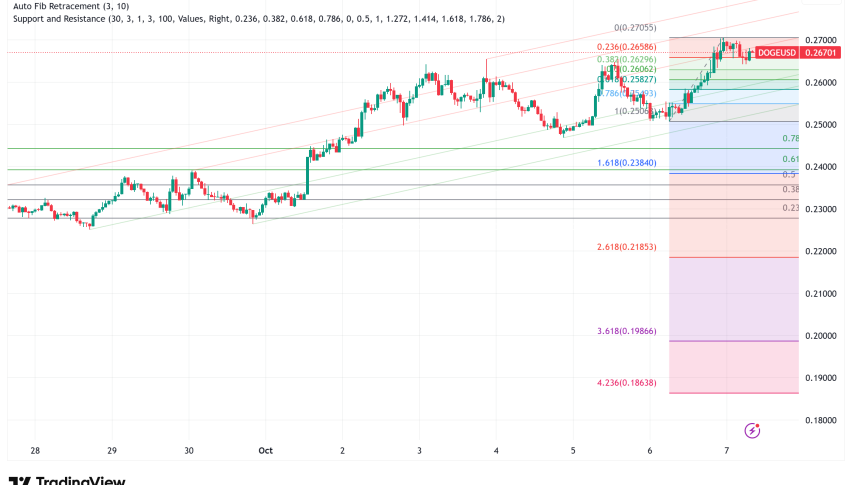
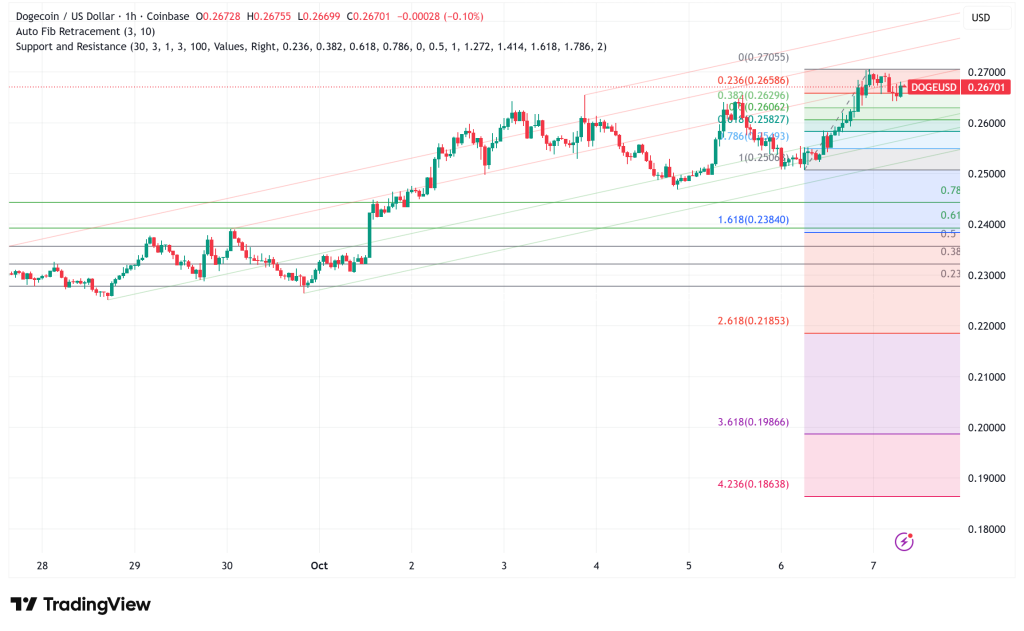
DOGE/USD Technical Analysis: Critical Resistance at $0.2626 Fibonacci Level
Dogecoin is technically coiling under a key 0.618 Fibonacci retracement mark near $0.2626, which analysts say is the next step toward gaining momentum. This is part of a strong resistance range between $0.26 and $0.28, which is made stronger by the weekly Ichimoku cloud edge and the 50-week moving average.
A strong close above $0.2626–$0.275 would confirm a move toward the psychologically crucial $0.30 barrier. Targets go up to $0.32–$0.34 (20% more), and if momentum picks up, historical Fibonacci levels around $0.33–$0.35 and $0.41 will also be important.
The daily chart shows a symmetrical triangular pattern, and the price action is getting tighter, which means that the market is getting ready for a big move. If DOGE breaks through triangle resistance, technical goals might reach $0.29810, $0.33781, $0.39434, and maybe even $0.46635, which would be a 75% gain from where it is now.
Strong Support Structure at Key Moving Average
On the other hand, DOGE still has support between $0.24–$0.25, which is where it broke out and tested again. The daily 200-period simple moving average (SMA200) between $0.22046–$0.20927 adds strength to this area because it has always been a good support level. There are more levels at $0.23 and $0.22. If it loses $0.24, the bullish structure will be broken and there is a chance of a bigger pullback.
Momentum Indicators and 42-Day Cycle Align
A number of momentum indicators back up the increasing trend. The Positive Directional Indicator is above the Negative Directional Indicator, and the Average Directional Index is going up. The MACD has now turned positive. DOGE is still trading in an upward channel that has been guiding higher lows since the middle of 2025.
Price recently broke out of a downward channel and cleanly retested the upper border as support, which is a classic reversal pattern. On longer timeframes, some analysts see a megaphone pattern that is getting bigger. This could speed up the rise toward $0.70 later in the cycle.
Dogecoin seems to follow a 42-day time cycle that goes back and forth between pullback and recovery phases. Historical data suggests that DOGE has made huge profits of up to 1,000% during bull markets that lasted 27 to 42 days. The latest drop from $0.433 to present levels fits this pattern, which means that a recovery phase is about to start.
Macro Correlation Points to Long-Term $1 Target
Analysts are also looking at how Dogecoin’s price moves in connection to changes in the global M2 money supply. Charts from the past demonstrate that DOGE tends to follow the trend of increasing global liquidity, which is a sign of a positive trend. Analysts say that the meme coin might eventually rise to $1, which would be a 289% increase, because M2 is exhibiting signs of growth.
Long-term technical trends suggest that DOGE may be finishing a Cup and Handle pattern. Some analysts think that with a good breakout and retest, the market capitalization might rise from its present $40 billion level to $100 billion.
Dogecoin Price Prediction: Consolidation Before Breakout
Dogecoin has all the right components for a big breakout: whales are buying more, the supply on exchanges is going down, and the price is dropping below strong resistance. The 42-day cycle, the symmetrical triangle, and the SMA200 support all coming together make for a strong setup.
But validation is still very important. To prove the bullish argument, traders should look for a clear close over $0.2626–$0.275. In the meantime, it’s expected that the price will keep moving between $0.24 and $0.28. Because DOGE is so volatile, it’s still important to keep a close eye on support zones, breakout levels, and risk management.
- Check out our free forex signals
- Follow the top economic events on FX Leaders economic calendar
- Trade better, discover more Forex Trading Strategies
- Open a FREE Trading Account
- Read our latest reviews on: Avatrade, Exness, HFM and XM
Related Articles


Sidebar rates
Related Posts
