Ethereum Holds $4,300, Institutional Staking and On-Chain Activity Signal Path to $10,000
Ethereum is trading above $4,300 right now, which is down 1.3% in the last 24 hours. However, the asset's core fundamentals still look good
Quick overview
- Ethereum is currently trading above $4,300, down 1.3% in the last 24 hours, but its long-term fundamentals remain strong.
- On-chain metrics indicate a surge in network activity and institutional interest, suggesting a potential breakthrough for ETH in the coming weeks.
- The growth of tokenized real-world assets on Ethereum has significantly increased, with a market share of over 56%, highlighting its dominance in this area.
- Grayscale's recent staking of 857,600 ETH reinforces institutional confidence in Ethereum as a foundational asset for the new digital economy.
Ethereum ETH/USD is trading above $4,300 right now, which is down 1.3% in the last 24 hours. However, the asset’s core fundamentals still look good for long-term growth. Even though the price has been going up and down a lot lately and has been turned down several times near the $4,800 resistance mark, on-chain metrics and institutional activity signal that ETH may be getting ready for a big breakthrough in the next few weeks.
Ethereum, the second-largest cryptocurrency by market capitalization, has been under selling pressure along with Bitcoin. However, analysts say that Ethereum’s growing network structure and real-world asset tokenization use cases give a strong base for ongoing upward momentum.
On-Chain Activity Reaches “New Normal” as Network Engagement Surges
According to data from CryptoQuant, Ethereum’s network activity has changed fundamentally. Daily internal contract calls have gone up from an average of 7 million to over 9.5 million since mid-July. This statistic, which looks at complicated network interactions like decentralized financial protocols and tokenization of real-world assets, shows that the ecosystem is getting deeper instead of just being volatile.
Three things coming together have caused the rise in on-chain activity: clearer rules about stablecoins in the US, record amounts of institutional money going into spot Ether ETFs, and what analysts call a “treasury war” among companies that are buying ETH as a long-term reserve asset. These changes have caused gas use and stake participation to reach their maximum levels in 2025.
Tokenized Real-World Assets Boom on Ethereum Network
Another big reason why people want Ethereum is the growth of tokenized real-world assets. RWA.xyz says that the entire value of tokenized RWAs has gone up by a huge 680% from $1.5 billion in January 2024 to $11.71 billion in 2025. Ethereum has a huge 56.27% market share in this area, which is over five times bigger than its closest rival, ZKsync Era, which has 11.83%.
The BUIDL fund from BlackRock is the biggest tokenized RWA product and has over $2.4 billion worth of Ethereum. The network is popular with institutional players since it is the most reliable and has never gone down since it started. This is very different from competitors like Solana, which has had at least seven major outages in the last five years.
Grayscale Stakes $3.83 Billion in Ethereum, Reinforcing Institutional Conviction
Lookonchain’s on-chain data shows that Grayscale just staked an extra 857,600 ETH, valued around $3.83 billion, through its ETHE and ETH ETF products. This is a big indicator of institutional trust. This huge staking transaction lowers the amount of Ethereum that is available for trading, which increases Ethereum’s deflationary pressure, especially since network activity and gas usage are still high.
The size of Grayscale’s staking move shows that big banks are starting to see Ethereum as more than just a speculative commodity. They see it as important digital infrastructure that will be the foundation of the new tokenized economy and decentralized finance ecosystem.
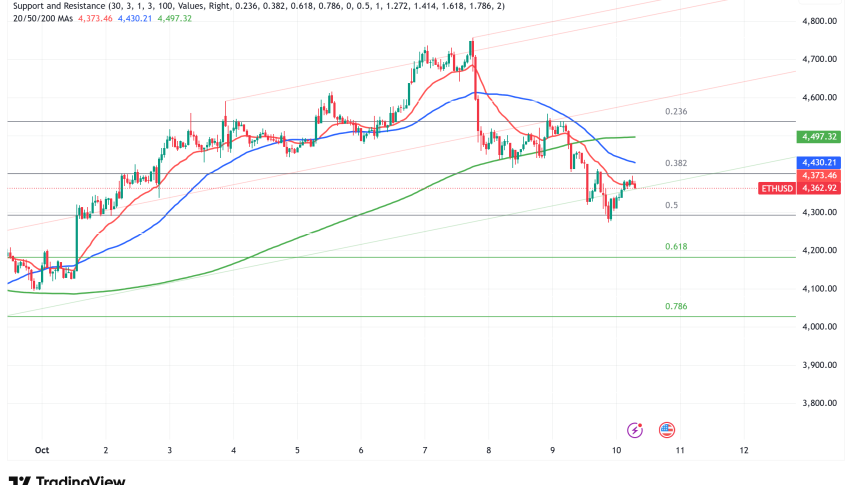
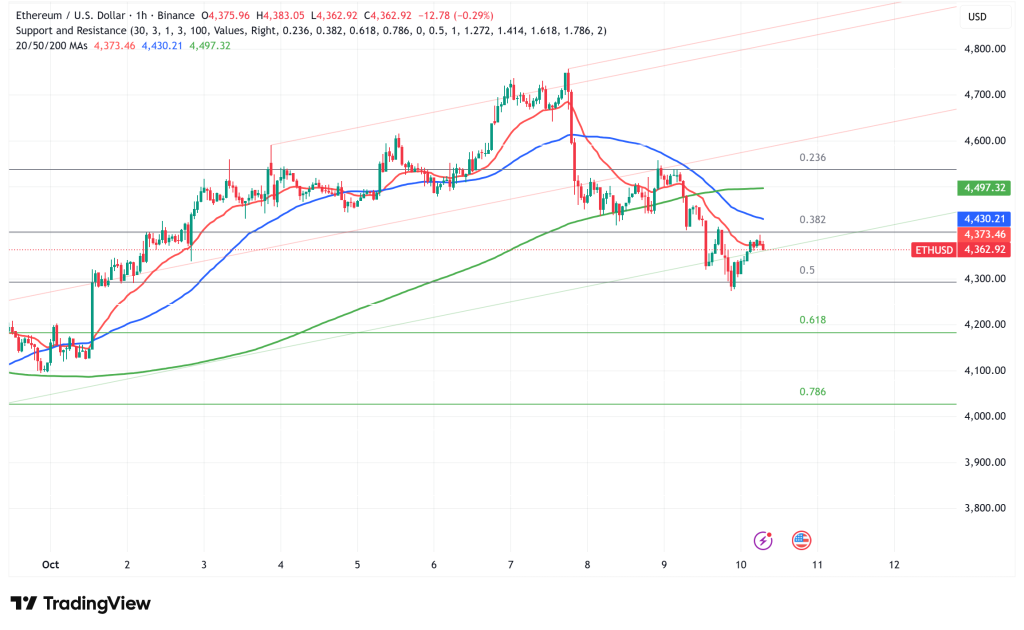
ETH/USD Technical Analysis: Critical Support Band Between $4,100-$4,250
From a technical point of view, Ethereum seems to be getting close to an important support zone between $4,100 and $4,250. This is where daily and four-hour order blocks have historically been linked to substantial buying activity. The four-hour chart’s relative strength index is getting close to being oversold, which could mean that a short-term bottom is forming.
ETH has pulled back into its 200-period moving average on the 4-hour chart after being turned down for the fourth time at the $4,800 resistance level in less than ten weeks. This is an important dynamic support level that often serves as a pivot point for market direction. The present range of $4,300 to $4,340 is where the 50-, 100-, and 200-period moving averages all meet. This suggests that this dip could just be a technical retest before another attempt to reach higher levels.
Ethereum Price Prediction: $4,000 Dip or $10,000 Breakout?
People in the market still have different opinions about where Ethereum is going in the short run. Trader Crypto Caesar said that even though there could be a short-term drop below $4,000, it could be the last shakeout before a surprise climb toward $10,000 later this month. Investor Jelle pointed out Ethereum’s breakout from a megaphone pattern, which is a technical structure that commonly comes before big price moves higher, to back up the positive perspective. The target price is still $10,000.
But if selling pressure rises and ETH closes clearly below $4,200, the market could go through a further drop toward $4,000 or even $3,850, where it had previously consolidated.
- Check out our free forex signals
- Follow the top economic events on FX Leaders economic calendar
- Trade better, discover more Forex Trading Strategies
- Open a FREE Trading Account
- Read our latest reviews on: Avatrade, Exness, HFM and XM
Related Articles


Sidebar rates
Related Posts
