Bitcoin Tests $110,000 Support, Technical Signs Points to Rally Past $130,000
Bitcoin is still above $113,000 following a rough 1.5% drop in the last 24 hours, but a more complex story is starting to emerge in the
Quick overview
- Bitcoin remains above $113,000 despite a recent 1.5% drop, indicating a potential recovery toward $133,000 by month-end.
- The recent market turmoil was characterized by systematic institutional deleveraging rather than forced liquidations, showcasing improved risk management among traders.
- Current technical analysis suggests that Bitcoin must hold above $107,000 to avoid deeper corrections, with key support levels around $110,000 to $112,000.
- Ostium Labs predicts Bitcoin could reach $125,000 by next week and $133,000 by the end of the month if it successfully breaks resistance levels.
Bitcoin BTC/USD is still above $113,000 following a rough 1.5% drop in the last 24 hours, but a more complex story is starting to emerge in the market. At first, it looked like a chaotic crash, but now it’s clear that it was a systematic institutional deleveraging event. This is very different from prior crypto cycles, which were distinguished by cascading liquidations. As the world’s biggest cryptocurrency settles at important support levels, top analysts are becoming more and more sure that the violence has cleared the way for a possible explosive recovery toward $133,000 by the end of the month.
The Great Deleveraging: Panic Selling Replaced by Prudent Risk Management
Last week’s market chaos caused Bitcoin to drop from resistance levels of $116,000–$117,500 to lows of approximately $103,000. This wiped out billions in paper profits and caused a lot of worry across the crypto ecosystem. But top trader Axel Adler’s study of the data shows that the market structure is more complex than predicted. During the sell-off, spot trading volume shot up to $44 billion and futures volume hit $128 billion, which was close to cycle highs. However, open interest fell by $14 billion, with only $1 billion coming from forced liquidations.
This important difference shows that 93% of the deleveraging was done on purpose. Instead than being forced to liquidate by a series of margin calls, institutional players and smart traders manually lowered their risk and ended their positions. This conduct is very different from what happened in past bad markets, when identical catastrophes usually led to frantic liquidation cascades that made losses much worse. The maturity shown by people in the market implies that Bitcoin’s market structure has changed a lot, and that bigger players are better at managing risk during times of stress.
BTC/USD Technical Breakdown: Support Holds Despite Momentum Weakness
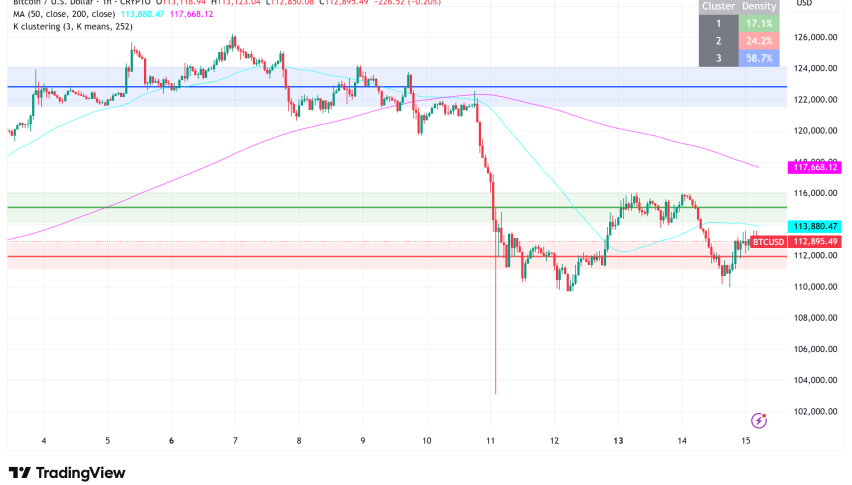
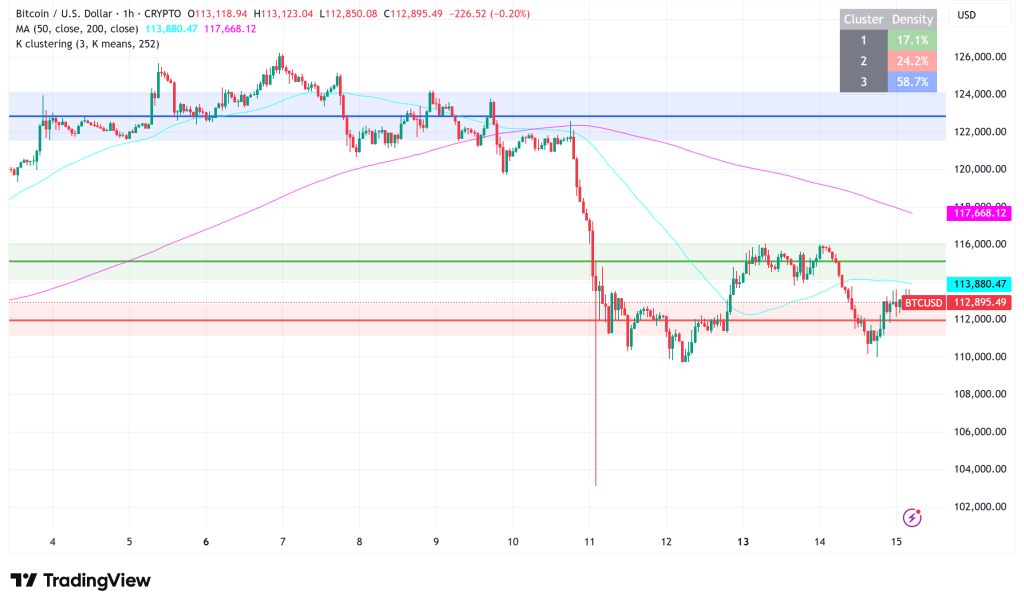
Bitcoin’s current position on the 4-hour chart shows that it is in a weak balance. BTC fell below both the 50-day and 200-day exponential moving averages after rejecting the $116,000–$117,500 supply zone many times. This is a hint that short-term momentum is waning. The price is now dangerously close to the $110,300 support level, which was a zone of demand during the late September correction.
There are two important situations that the technological setup shows. If Bitcoin closes below $107,000 on a daily basis, it might go down to deeper levels of correction around $105,000–$106,000 and possibly even $99,000 if the structure breaks strongly. On the other hand, if the $110,000–$112,000 zone is successfully defended, it might create a “higher low” pattern, which is what analysts are looking for to affirm that the market will continue to rise.
The 200-day moving average near $106,000 has been a significant accumulation zone in the past and was the last point of capitulation during the current flush. Ostium Labs, a well-known crypto trading desk, says that a weekly close below $107,000 is the main reason why their bullish thesis is wrong. They see it as the “line in the sand” before bear market worries become serious.
Bitcoin Price Prediction: The $133,000 Target on Month-End Horizon
If Bitcoin stays above $107,000, Ostium Labs’ most recent market outlook makes a very positive case. The company says that the weekly chart structure stayed the same during the crash, with prices dropping to $107,000 before rising back up to $115,000. They see this pattern as proof that higher-timeframe momentum is still optimistic.
The route forward is clear from here: Bitcoin should hold around $112,000 as support, then turn back around and smash over the $116,000 resistance. This sequence would lead to a move toward $123,800, which was the previous range high, and eventually to price discovery above that level. The desk’s short-term timing is good: they think Bitcoin will be worth $125,000 by the beginning of next week and $133,000 by the end of the month.
Their setup shows that the best place to enter longer-term positions is between $110,000 and $112,000, with a hard stop at $105,000. The first objective is $121,000, but there is room for far bigger gains if the pattern plays out as planned. The thesis is based on two main ideas: new liquidation maps for one-week and one-month periods that show a “cleaner tape” for trend continuation, and low open interest and margin positions that signal fuel for a long-term rally.
- Check out our free forex signals
- Follow the top economic events on FX Leaders economic calendar
- Trade better, discover more Forex Trading Strategies
- Open a FREE Trading Account
- Read our latest reviews on: Avatrade, Exness, HFM and XM
Related Articles


Sidebar rates
Related Posts
