Ethereum Holds Strong Above $3,800, Technical Indicators Signal Potential Rally to $4,280
Ethereum (ETH) is showing a lot of strength in late October. It has stayed above $3,800 and gained 1.5% in the last 24 hours. The second
Quick overview
- Ethereum is showing strength in late October, remaining above $3,800 and gaining 1.5% in the last 24 hours.
- A triple bottom pattern on the 4-hour chart indicates a potential bullish breakout, with targets around $4,280 if resistance at $4,000 is surpassed.
- The critical support zone between $3,600 and $3,800 must hold for the bullish outlook to remain valid, as a drop below could lead to a deeper decline.
- On-chain data reveals that large investors, or 'mega whales,' are accumulating ETH during the current price correction, suggesting confidence in future price increases.
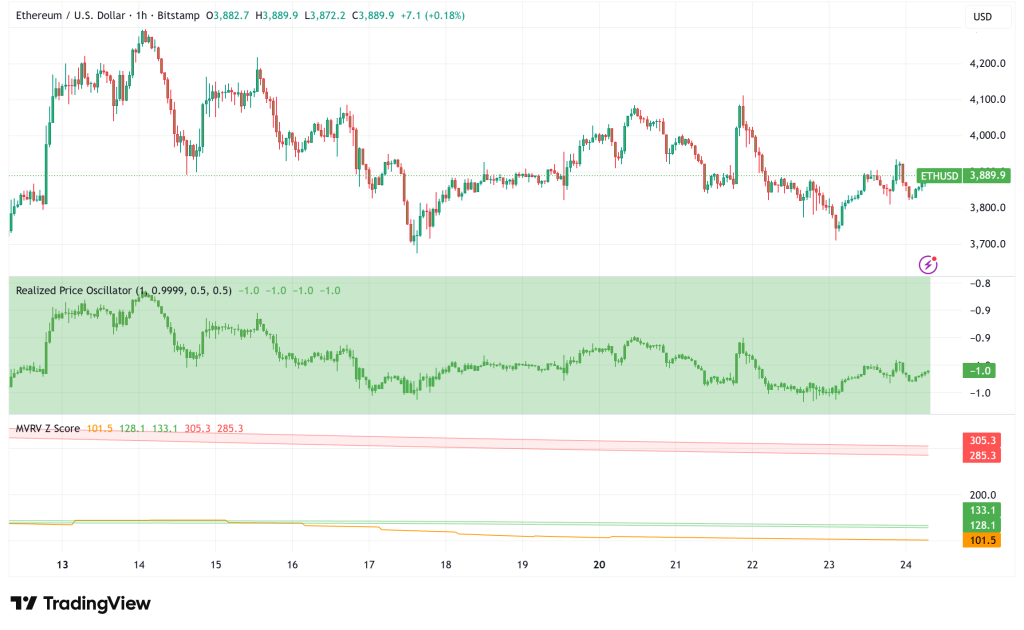
Ethereum ETH/USD is showing a lot of strength in late October. It has stayed above $3,800 and gained 1.5% in the last 24 hours. The second-largest cryptocurrency has dropped 6.5% this month, but technical analysis shows a strong bullish setup that could push prices up to $4,000 and higher in the next few weeks.
Triple Bottom Formation Points to Imminent Breakout
The appearance of a textbook triple bottom pattern on the 4-hour chart is the most important technical change for Ethereum. This classic reversal pattern happens when prices test the same support level three times without going lower. This shows that selling pressure is running out and buyer conviction is growing.
This important support zone for ETH is between $3,750 and $3,800, where buyers have always been able to keep the price up. Every time this level has been tested, sellers have lost steam, which could lead to a change in the trend.
The neckline resistance for the pattern is close to $3,950–$4,000, which is also where the 50-period exponential moving average lies. If the price breaks above this level, it would confirm the triple bottom setup and allow the price to go toward the pattern’s estimated target of about $4,280, which is a 10% increase from where it is now. Traders are hoping this breakout will happen by the end of October or the beginning of November.
During the construction of the pattern, trading volumes have been going down, which is normal behavior for a consolidation period before a big move. Technical analysts are looking for a big increase in purchasing volume to go along with any breakout above $4,000. This would be another sign that the market is turning bullish.
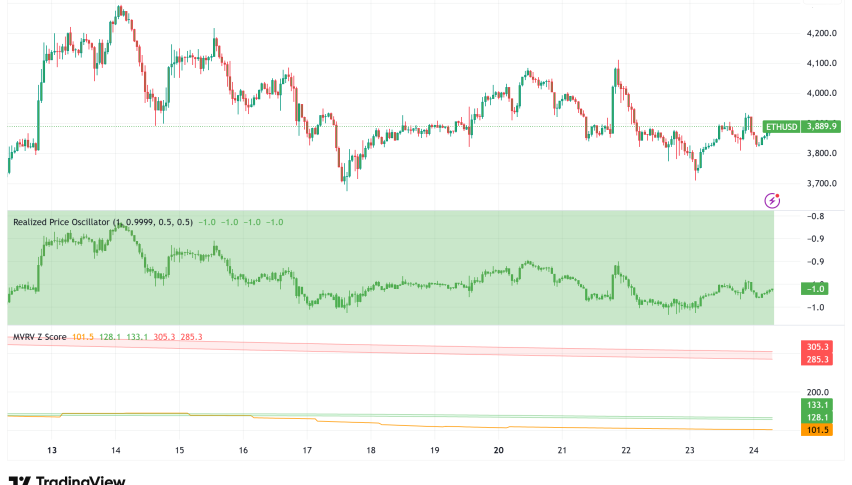
Structural Support Remains Intact Above Realized Price
Ethereum is still trading significantly above its Realized Price of about $2,300, which is the average cost base for all ETH holders. This level acts as basic support, and historical data shows that drops below it usually mean that people are giving up. The way things are set up right now makes it look like the market structure is still strong and bullish.
The Market Value to Realized Value (MVRV) ratio shows that ETH holders are making an average of 67% more than they paid for it. This number shows that the market is making money but not too much, which is the best situation for prices to keep going up without too much excitement that usually comes before corrections.
Analysts say that Ethereum’s recent drop from the Upper Realized Price Band of about $5,300 is a sign of a healthy consolidation phase, not a structural reversal. This cooling off period, along with the fact that spot inflows to exchanges are slowing down, suggests that the next surge will probably be powered by new money coming in instead of leverage.
Critical Support Zone Holds Key to Rally Continuation
Several technical analysts say that the $3,600–$3,800 area is the key support zone that must hold for the bullish perspective to be true. As long as ETH stays at this level, the way to $4,700 and maybe even new all-time highs is still open.
Some analysts think that the present consolidation could lead to a right shoulder formation, which would complete both a Cup and Handle pattern and an Inverse Head and Shoulders formation at the same time. This is a rare combination of bullish settings that could lead to a lot of upward momentum.
Mega Whales Quietly Accumulating During Correction
Glassnode’s on-chain data shows that there has been a big redistribution of Ethereum supply, which supports the bullish argument. During the current price drop, “mega whales,” or large wallets holding 10,000 to 100,000 ETH, have been growing at their fastest rate in years.
These institutional-scale investors currently own about 28 million ETH, which they got from smaller whale groups that sold it. During last month’s slump, wallets with 1,000 to 10,000 ETH saw their balances drop dramatically. This suggests that mid-sized holders either sold when prices were low or bought enough to move up to the larger group.
This pattern of accumulation usually means that smart investors see the current price levels as good places to buy, which gives the technical setup a solid foundation.
Ethereum Price Outlook and Risk Factors
Based on the triple bottom pattern, short-term price goals are about $4,280, with $4,000 acting as a barrier in the middle. If momentum keeps going over current levels, analysts say the targets will be between $4,700 and $5,000, with some estimates going as high as $6,800 based on supply and demand and exchange funding rates.
But traders should still be careful. For the bullish argument to work, support must stay above $3,600. If it breaks below this level, the current setup would be invalidated and a deeper decline could happen. Also, the fact that exchange reserves are going down and spot inflows are slowing down means that any rally would need new capital to keep going.
- Check out our free forex signals
- Follow the top economic events on FX Leaders economic calendar
- Trade better, discover more Forex Trading Strategies
- Open a FREE Trading Account
- Read our latest reviews on: Avatrade, Exness, HFM and XM
Related Articles


Sidebar rates
Related Posts
