Bitcoin Holds $103K Despite One-Third of Supply in Loss: Technical Analysis Points to Year-End Recovery
Bitcoin is trading above $103,000, up more than 2.5% in the last 24 hours. However, onchain data shows that about 33% of the circulating
Quick overview
- Bitcoin is currently trading above $103,000, with about 33% of its circulating supply held at a loss, indicating potential seller exhaustion.
- Onchain metrics suggest that the market may be nearing a reset phase, as historical patterns show that significant selling pressure often precedes recovery.
- Social sentiment around Bitcoin has dropped significantly, which historically aligns with local price bottoms, suggesting a contrarian opportunity for investors.
- Technical analysis indicates that Bitcoin may consolidate between $98,000 and $103,000, with potential for a recovery rally if key support levels hold.
Bitcoin BTC/USD is trading above $103,000, up more than 2.5% in the last 24 hours. However, onchain data shows that about 33% of the circulating supply is now held at a loss, which is the same percentage as in September 2024. Some people think that the market is getting close to a key reset phase, while others think it’s just getting ready for another leg up. This is because of the strange relationship between price strength and holder profitability.
Bitcoin’s Onchain Metrics Suggest Seller Exhaustion Rather Than Breakdown
CryptoQuant data shows that one-third of the overall circulation of Bitcoin is now held at a loss. This is a historically important level that usually means sellers are running out of steam rather than the start of a long-term decline. These levels usually show up during the highest points of liquidity stress, when most weak hands have already left their positions. This lets the markets reset structurally.
The seven-day short-term holder Spent Output Profit Ratio (SOPR) is now at 0.9904, which is below the important 1.0 level that shows coins are being sold at a loss. The SOPR’s Z-score is -1.29, which means there is moderate selling pressure. In August 2024, the same indicator fell to 0.9752 with a Z-score of -2.43, which showed much further surrender. The current number isn’t too bad, which means that the market hasn’t reached a point of great anxiety yet. This could mean that there is still opportunity for more losses before the bottom really emerges.
Social Sentiment Collapse Creates Contrarian Opportunity
Santiment’s data shows that Bitcoin’s Positive/Negative Sentiment ratio on social media has dropped dramatically. The current reading is the third-lowest level in six months. It’s interesting to note that the last two times sentiment was this low, it was at local price bottoms. This shows that Bitcoin has a history of going against what most people think.
Ethereum’s mood has gotten even worse, reaching its second-lowest level in the past six months. XRP and most other altcoins, on the other hand, don’t seem to be very interested, and neutral mood readings show that retail interest has mostly been focused on Bitcoin and Ethereum.
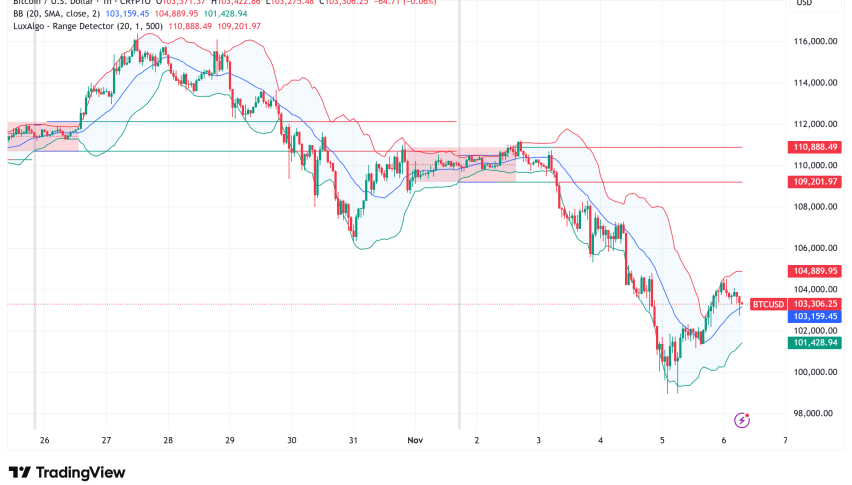
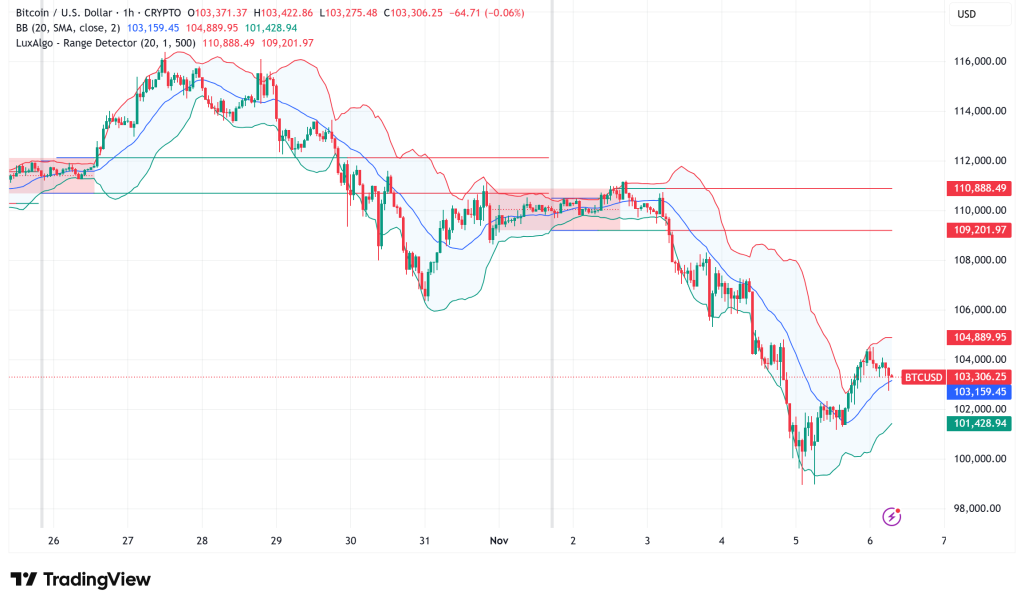
BTC/USD Technical Analysis: Points to $98K-$103K Consolidation Zone
From a technical point of view, Bitcoin is still following the pattern shown in the research from mid-October. It is now testing the $103,500-$98,100 order block again, which is a major area of demand that was set up during the last price discovery. Based on momentum indicators, the market structure looks like it has been oversold. However, historical patterns show that recovery usually comes after a long period of consolidation, not right away with a V-shaped reversal.
If prices stay within the present range, a lot of short bets in the futures markets might lead to a big short squeeze. A daily close below $98,100, on the other hand, would invalidate the bullish setup and might show the yearly open near $93,500 as the next support level.
Volume-Weighted Average Price (VWAP) analysis shows that Bitcoin is challenging important support, and momentum indicators show that it is oversold, which has happened before when prices bounced back. But you may need to be patient because it might take weeks, not days, for durable bottoms to form.
Institutional Adoption Accelerates Despite Market Volatility
BlackRock’s statement that it will list an iShares Bitcoin ETF on the Australian Securities Exchange in mid-November 2025 shows that institutions are still interested, no matter what happens to the price in the short term. The offering, which includes BlackRock’s $85 billion US iShares Bitcoin Trust and a competitive 0.39% management fee, will give Australian investors regulated access to Bitcoin through exchange infrastructure they already know.
Since early 2024, there has been a lot of acceptance for spot Bitcoin ETFs around the world. This expansion shows that big asset managers see the present market conditions as a chance to make money rather than a problem. The launch’s timing, which might be around the end of the year when people are looking to make tax-loss sales and rebalance their portfolios, could bring in new money.
Bitcoin Price Prediction: Cautious Optimism for Year-End Recovery
Based on the present technical and fundamental signs, Bitcoin looks like it will slowly rebound rather than go up quickly. The $98,000 to $103,000 area is expected to remain a place where people buy and sell until mid-November. If selling pressure grows, there is a chance that $93,500 may be tested again.
If the market keeps its present support levels and short-term holders keep giving up, though, Bitcoin might find a stable bottom in the next two to four weeks. If the $98,100 level holds and sentiment metrics improve, it might start a recovery rally that targets $110,000 to $115,000 by the end of the year.
The fact that social media sentiment has dropped and SOPR readings are just moderate (not excessive) signals that the market may need one last flush before it can go up for good. Investors should keep an eye on daily closes around $98,100 and look for SOPR Z-scores that are close to -2.0 or below. These could be signs of capitulation that would make them more sure of a long-term bottom.
- Check out our free forex signals
- Follow the top economic events on FX Leaders economic calendar
- Trade better, discover more Forex Trading Strategies
- Open a FREE Trading Account
- Read our latest reviews on: Avatrade, Exness, HFM and XM
Related Articles


Sidebar rates
Related Posts
