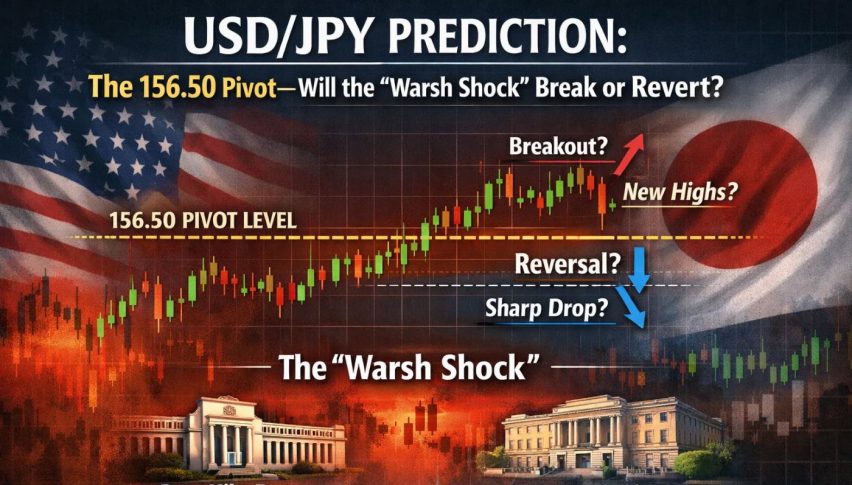
USD/JPY Prediction: The 156.50 Pivot—Will the “Warsh Shock” Break or Revert?
In the European session, USD/JPY kept moving higher, trading near 155.87 and hitting a session high of 155.98.
Quick overview
- USD/JPY is trading near 155.87, supported by a strong US dollar recovery but limited by intervention concerns near 160.00.
- The Japanese Yen is under pressure due to election uncertainty and a dovish stance from Prime Minister Sanae Takaichi.
- The US dollar gains strength from a hawkish Fed outlook and positive economic indicators, including a new trade deal with India.
- Technical analysis suggests potential mean reversion risks for USD/JPY, with key resistance at 156.51 and support at 155.67.
In the European session, USD/JPY kept moving higher, trading near 155.87 and hitting a session high of 155.98.
The pair is supported by a strong US dollar recovery, but worries about possible joint US-Japan intervention near 160.00 are keeping gains in check.
Japanese Yen Under Pressure Amid Election Uncertainty
The Japanese Yen is under more pressure as the February 8 snap election nears. Prime Minister Sanae Takaichi has taken a dovish tone, saying a weak yen gives a “significant advantage” to exporters.
Her plan to suspend consumption taxes on food has raised concerns about Japan’s long-term fiscal health, leading investors to move out of the safe-haven Yen and into riskier assets.
US Dollar Gains on Hawkish Fed Outlook and Trade Deals
The US dollar’s strength is also helped by Kevin Warsh being nominated to replace Jerome Powell as Fed Chair.
Markets see this “Warsh Shock” as a sign of a tougher stance on inflation and a possible cut in the Fed’s balance sheet, which has tightened global liquidity and boosted the US dollar.
A new trade deal with India and strong ISM Manufacturing PMI data, which hit a three-year high of 52.6, have also given the dollar more support.
USD/JPY Technical Analysis: Mean Reversion Risks Amid Recovery
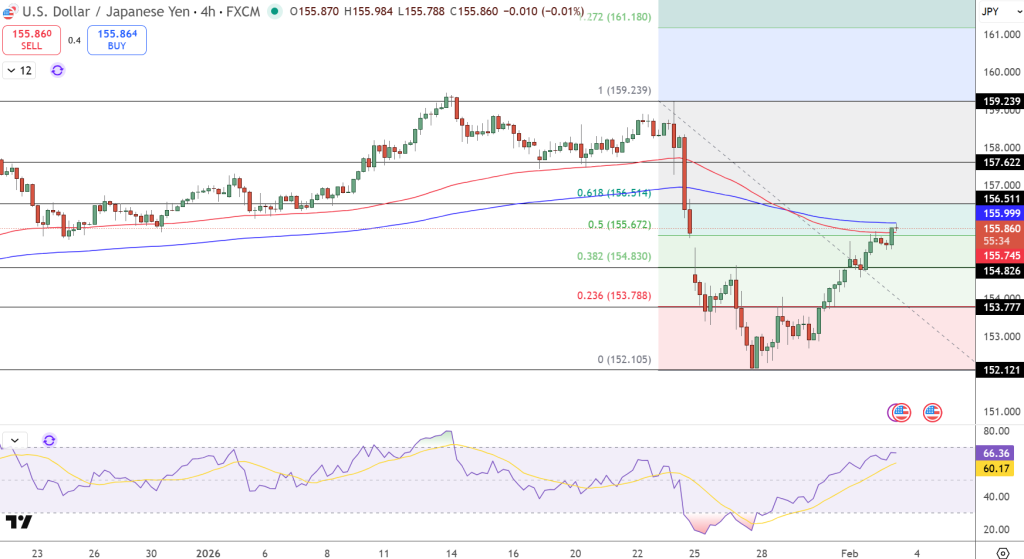
As of February 3, 2026, USD/JPY is making an important rebound from its January lows near 152.00.
- On the H4 chart, the pair is testing the 155.50 to 156.00 area, which matches the 0.618 Fibonacci level ($156.51) and the 200-SMA (blue line). The trend would turn bullish if the price holds above 157.00.
- The price is back above the 50-EMA (red line), and the RSI has jumped to 66.36. This high RSI means the pair is close to overbought, so a pullback is more likely.
- On the H1 chart, local highs are forming along the upper Bollinger Bands, but momentum is slowing near 155.60.
Key Price Levels to Watch
- Key resistance levels are at 156.51 (0.618 Fibo) and 157.62, with a major psychological barrier at 159.24.
- Support is found at 155.67 (0.5 Fibo) and 154.83 (0.382 Fibo). If the price falls below 153.78, it could retest the multi-month lows at 152.12.
Trade idea: Consider a short position if the RSI is overbought near 156.50, aiming for a pullback to 154.80 and setting a stop-loss above 157.10.
- Check out our free forex signals
- Follow the top economic events on FX Leaders economic calendar
- Trade better, discover more Forex Trading Strategies
- Open a FREE Trading Account
- Read our latest reviews on: Avatrade, Exness, HFM and XM
Related Articles
Sidebar rates
Related Posts
