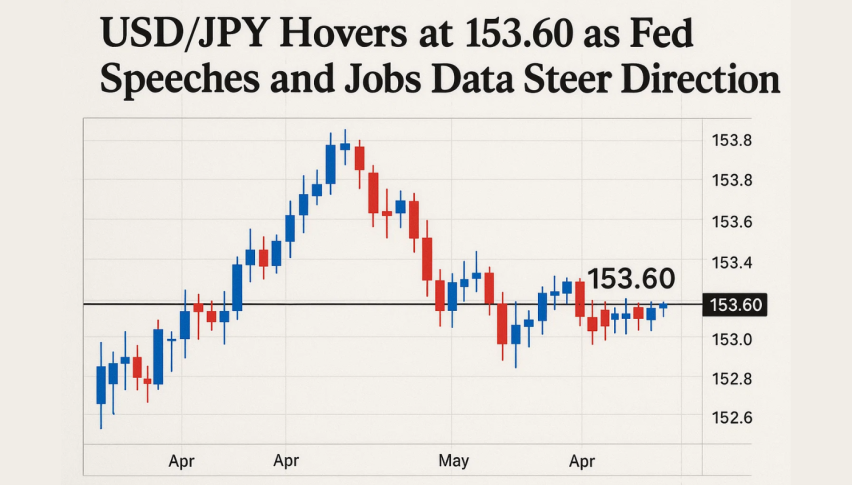
USD/JPY Hovers at 153.60 as Fed Speeches and Jobs Data Steer Direction
The U.S. dollar (USD/JPY) stayed steady on Thursday after a volatile start to the week, as traders weighed stronger labor data...
Quick overview
- The U.S. dollar (USD/JPY) remained steady after a volatile week, influenced by stronger labor data and mixed service sector indicators.
- The ADP Non-Farm Employment Change reported 42,000 new jobs in October, exceeding expectations and indicating resilience in the U.S. economy.
- Investor focus is shifting to upcoming Federal Reserve speeches for insights on potential policy shifts amid recent inflation moderation.
- Technical analysis shows USD/JPY is consolidating around 153.60, with key levels at 154.40 for bullish scenarios and 153.10 for bearish setups.
The U.S. dollar (USD/JPY) stayed steady on Thursday after a volatile start to the week, as traders weighed stronger labor data against fresh policy signals from the Federal Reserve. The ADP Non-Farm Employment Change showed 42,000 new jobs in October, outperforming expectations of 32,000 and recovering from September’s 29,000 contraction.
While the upbeat jobs figure hinted at resilience in the U.S. economy, mixed service sector data tempered enthusiasm.
The ISM Services PMI came in at 52.4, slightly higher than forecast, while the Final Services PMI slipped to 54.8, suggesting uneven business momentum.
Focus Shifts to Fed Commentary
Investor attention now turns to an active FOMC schedule, with speeches from members Barr, Williams, Hammack, and Waller. Markets are hoping for clarity on whether the Fed will maintain its cautious stance or signal a shift after recent inflation moderation and a softer labor market.
In Japan, Household Spending rose 2.5%, beating expectations and hinting at modest consumer optimism. Still, traders remain cautious as both the Federal Reserve and Bank of Japan maintain patient policy outlooks, keeping USD/JPY in consolidation mode.
USD/JPY Technical Analysis
The USD/JPY pair is currently around 153.60, stuck above a rising trend line that’s been supporting the market since mid-October—so far, at least. On the 4-hour chart, you can still see a higher low forming—but not as confidently as before —and momentum just isn’t as strong as it used to be.
On the looks of it, 154.40 looks like it could be a bit of a problem for the bulls, while anyone looking on the short side might be keeping an eye on 153.10 – a line in the sand that could get broken at any moment.
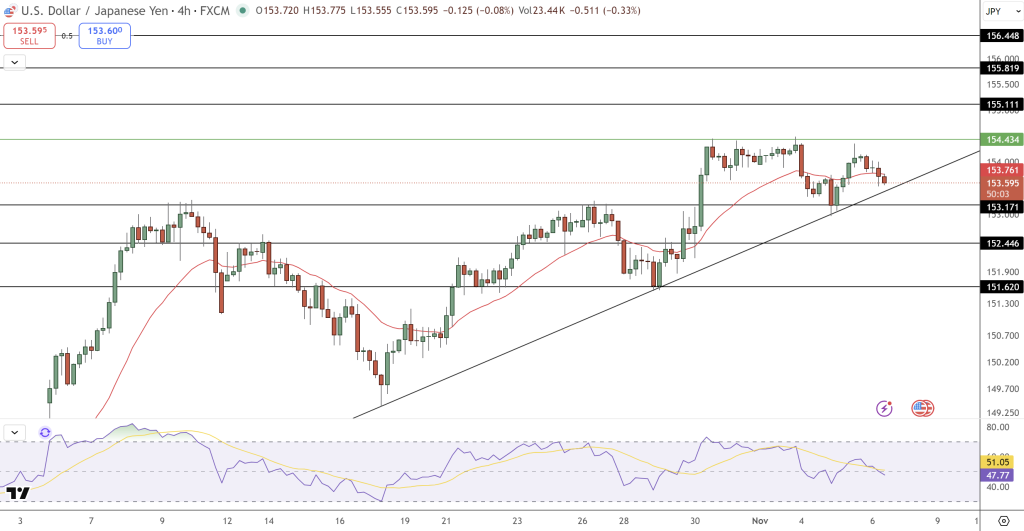
That 4-hour chart has been throwing up some interesting candles recently, though—a spinning top followed by a bearish engulfing pattern, which is basically asking whether the buyers have got the stomach for this sort of thing. On the RSI at 47, you can start to see some fading strength, and the 20-EMA has flattened out, which is pretty much the definition of market indecision.
Trade Opportunity
- Bearish Setup: Sell below 153.10, target 152.45, stop loss 153.80.
- Bullish Scenario: Buy on a bounce above 154.40, target 155.10–155.80 if RSI strengthens.
Overall, USD/JPY remains steady but fragile — with a breakout likely to define its next major move.
- Check out our free forex signals
- Follow the top economic events on FX Leaders economic calendar
- Trade better, discover more Forex Trading Strategies
- Open a FREE Trading Account
- Read our latest reviews on: Avatrade, Exness, HFM and XM
Related Articles


Sidebar rates
Related Posts
