Is a Bullish Rebound Coming for PayPal Stock?

Quick overview
- PayPal (PYPL) stock has dropped significantly from $93.50 to $56, with recent trading fluctuating between $65 support and $80 resistance.
- The stock has faced an 18% decline over the past two weeks, consistently closing below the 50-week EMA resistance at $70.60.
- Technical indicators show a bearish trend, with death crosses on multiple charts and MACD lines bearishly crossed.
- The outlook remains cautiously bullish long-term if the monthly EMAs and golden ratio support at $65 hold.
PayPal (PYPL) stock has faced steep losses since last year, falling from around $93.50 to $56. Since then, the stock has experienced volatile trading, oscillating between key support and resistance levels.
PayPal Stock Price Drops from $93.50 to $56, Key Levels to Watch
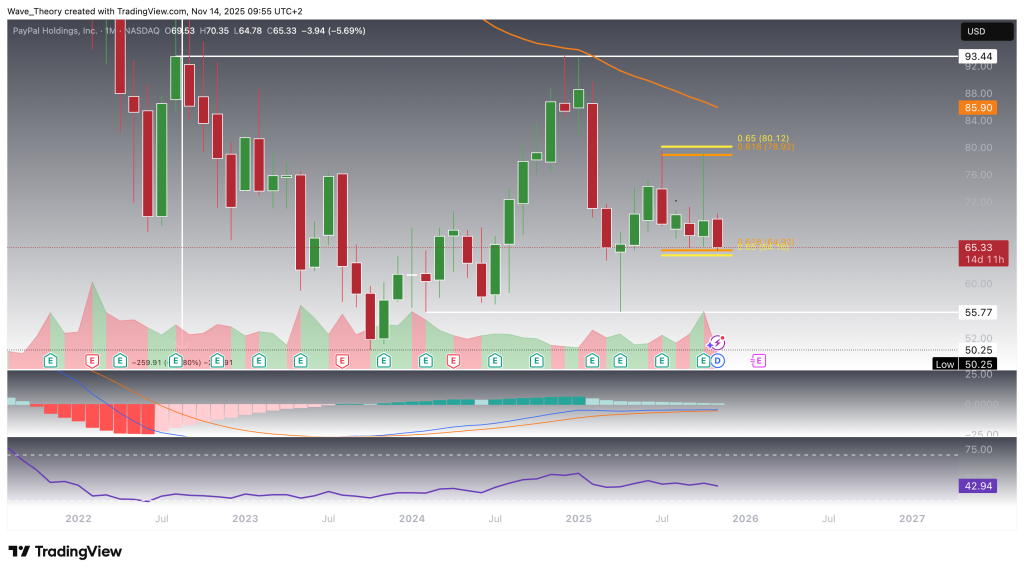
Since December last year, PayPal (PYPL) stock has nearly halved, falling from roughly $93.50 to $56. Following this sharp decline, the stock staged a strong recovery, climbing to the golden ratio resistance at $80, where it faced bearish rejection twice. The price subsequently retraced to the golden ratio support at $65, which has successfully held over the past three months.
Moving forward, PayPal may continue oscillating between the $65 support and $80 resistance levels. A bullish breakout above $80 could propel the stock toward the 50-month EMA at $86 or even the recent high near $94. Conversely, a bearish break below $65 could open the door to a decline toward the last local low around $56.
On the indicators side, the MACD histogram on the monthly chart shows a strong downtrend, while the MACD lines remain bullishly crossed, and the RSI sits in neutral territory, signaling potential for further directional movement depending on key support and resistance levels.
PayPal Stock Drops 18% Over the Past Two Weeks
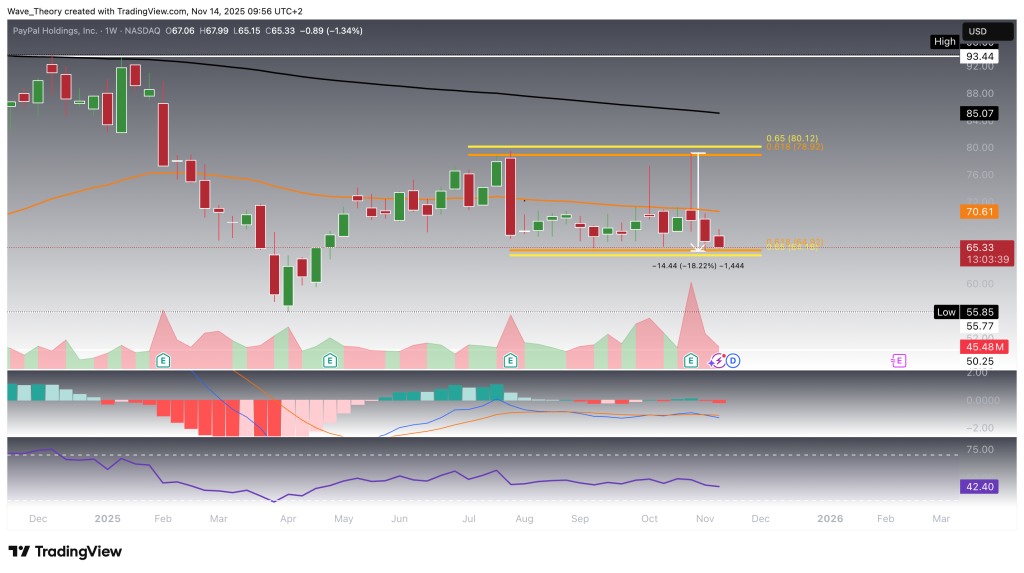
Over the last two weeks, PayPal (PYPL) stock has declined by 18%, reaching the golden ratio support near $65. The stock has also consistently closed below the 50-week EMA resistance at $70.60 over the past four months.
On the weekly chart, indicators signal medium-term bearish momentum: the MACD lines have crossed bearishly, the MACD histogram is trending lower, and the EMAs have formed a death cross, confirming the bearish trend. Meanwhile, the RSI remains in neutral territory, providing no immediate bullish or bearish signals.
Death Cross Appears on PayPal Daily Chart
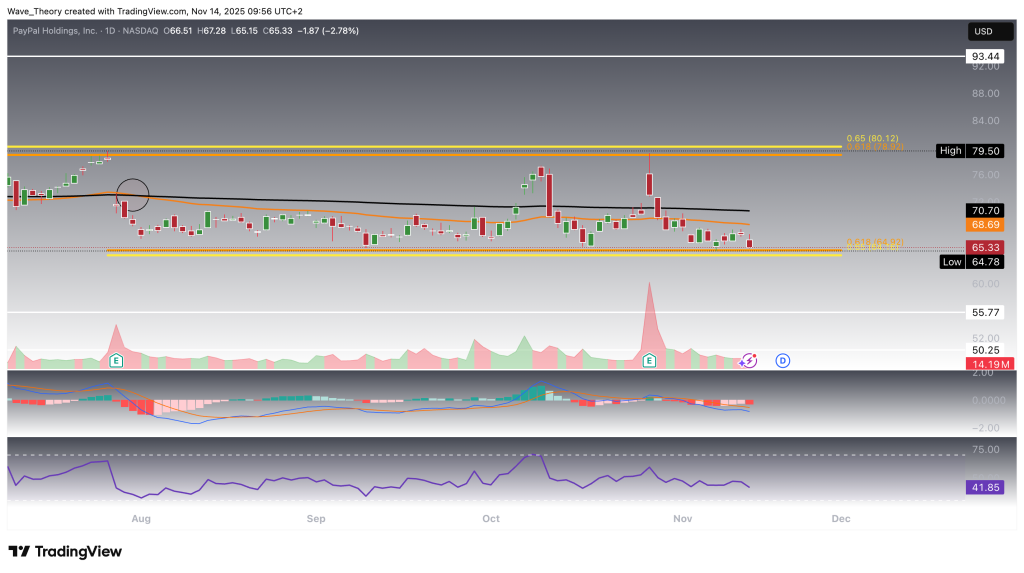
On the daily chart, PayPal’s EMAs formed a death cross in August, confirming a bearish trend in the short- to medium-term. The MACD lines are bearishly crossed, and the MACD histogram has started to tick lower today, following a brief bullish uptick over the past three days. Meanwhile, the RSI remains in neutral territory, providing no immediate bullish or bearish signal.
Similar Bearish Outlook on the PayPal 4-Hour Chart
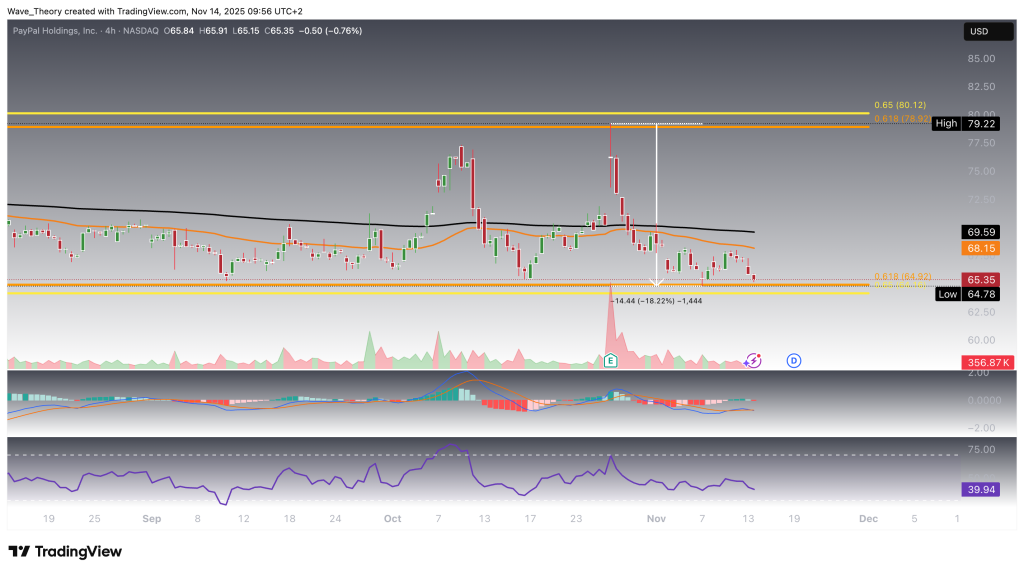
On the 4-hour chart, PayPal’s EMAs also display a death cross, confirming a short-term bearish trend. Additionally, the MACD lines are bearishly crossed, and the MACD histogram continues to trend lower, while the RSI remains neutral, providing no clear directional signal.
PayPal (PYPL) Stock Technical Summary
-
Current Price: ~$65
-
Short-Term Resistance: 50-week EMA near $70.60, golden ratio resistance at $80
-
Short-Term Support: Golden ratio support at $65, last local low near $56
-
Long-Term Support: historical lows between $50 and $56
-
Indicators:
-
MACD: Bearishly crossed on daily/weekly/4H charts; histogram trending lower
-
RSI: Neutral across most timeframes
-
EMAs: Death crosses on weekly, daily and 4H charts
-
Outlook:
-
Short-term: Correction ongoing; key support at $65 critical.
-
Medium-term: Bearish signals dominate as long as price stays below $70–$71.
-
Long-term: Trend remains cautiously bullish on the monthly chart, provided monthly EMAs and golden ratio support hold.
- Check out our free forex signals
- Follow the top economic events on FX Leaders economic calendar
- Trade better, discover more Forex Trading Strategies
- Open a FREE Trading Account
- Read our latest reviews on: Avatrade, Exness, HFM and XM
Related Articles


Sidebar rates
Related Posts
