Ethereum Tests 4-Month Low at $3,000: Technical Indicators Signal Potential Bottom Formation
Ethereum is going through one of its hardest times in the last few months. It is trading at about $3,000, down roughly 3% in the last 24 h
Quick overview
- Ethereum is currently trading around $3,000, down 3% in the last 24 hours, raising concerns about the end of the bull market.
- The price is nearing a key accumulation zone at $2,895, which has historically indicated market bottoms.
- Technical indicators suggest that selling pressure may soon ease, with rare oversold signals appearing on Ethereum's daily chart.
- Despite macroeconomic challenges, Ethereum's long-term holders continue to accumulate, indicating confidence in the asset's future.
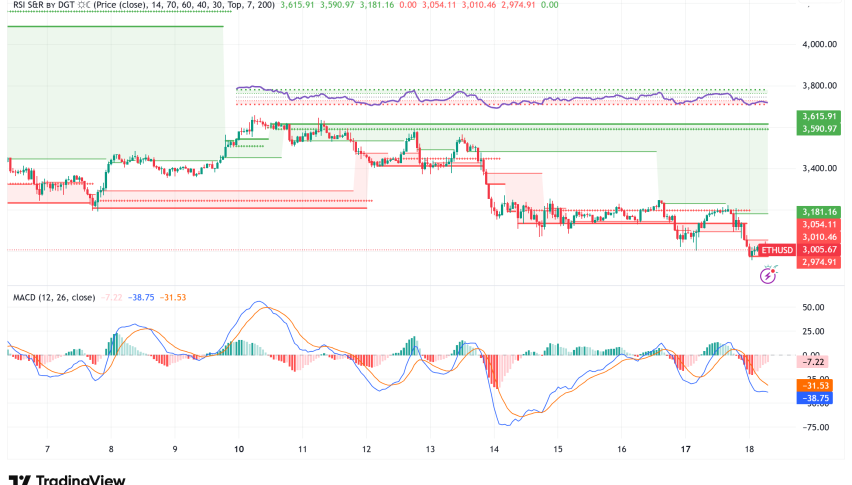
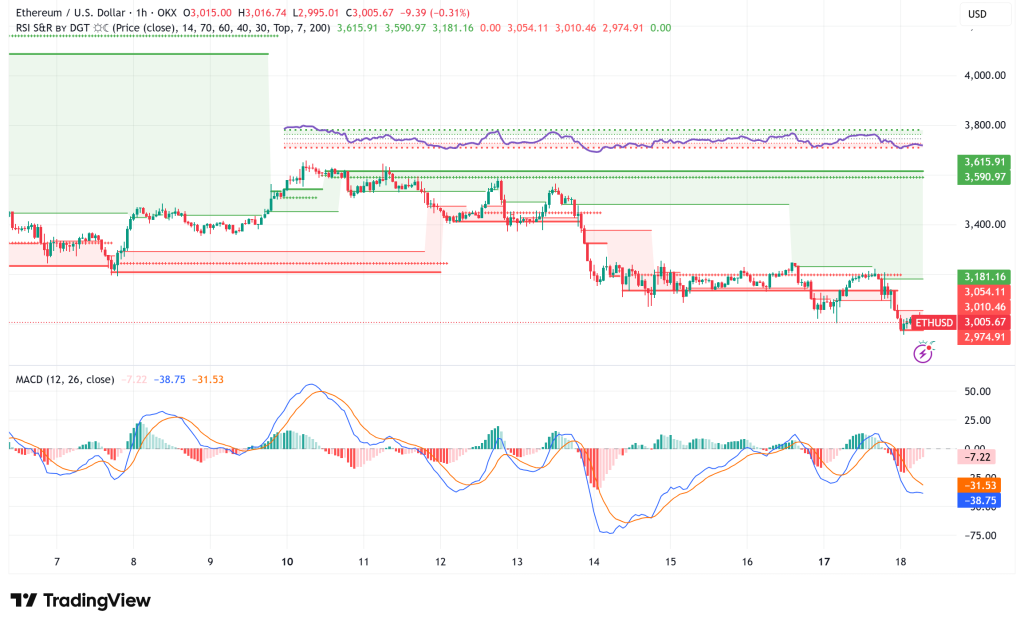
Ethereum ETH/USD is going through one of its hardest times in the last few months. It is trading at about $3,000, down roughly 3% in the last 24 hours. The second-largest cryptocurrency has dropped to levels not seen since July, which has led to worries that the bull market may be over. However, a number of technical and on-chain signs point to the fact that ETH may be getting close to a key accumulation zone that has historically signified the bottom of the market.
ETH Long-Term Holder Cost Basis Within Striking Distance
One of the most important things that has happened is that Ethereum is very close to the Accumulation Addresses Realized Price of $2,895, which is only 8% below where it is now. This number shows the average cost basis of long-term investors who have bought ETH over several market cycles. Burak Kesmeci, an analyst at CryptoQuant, says that this level has only been broken once before, during the tariff crisis of April 2025, when global economic anxiety was at an all-time high.
Long-term holdings are still impressively strong. During 2025, almost 17 million ETH went into accumulation addresses, bringing the total amount held from 10 million to more than 27 million ETH. This steady accumulation during times of uncertainty shows that Ethereum’s most dedicated investors are confident in their investments and see corrections as chances to get in rather than reasons to sell.
Rare Oversold Technical Signals Flash Warning for Bears
Ethereum’s daily chart is showing technical situations that are very rare in its trading history. The MACD indicator has dropped into the historically important -210 to -220 range, which has been a key market bottom in the past. This extreme reading, along with an RSI that is very oversold, makes a strong case that selling pressure may be about to end.
Even though oversold conditions might last longer than expected, especially during prolonged downtrends, these kinds of extreme momentum readings generally come before big relief rallies. The weekly chart reveals that ETH is staying above the 200-week moving average, which is a fundamentally important support level that has held key bottoms in the past. This level is close to $3,000.
Macro Headwinds and Layer-2 Transition Create Mixed Fundamentals
There are real macroeconomic worries that are causing the broader market to be weak. Uncertainty in the US government, additional tariffs, and doubts about the value of AI companies have made the whole sector more risk-averse. ETH futures premiums have stayed low, below the 5% neutral threshold, for more than a month, which shows that leveraged traders are still hesitant.
On-chain measurements show that things are hard. Over the course of 30 days, Ethereum’s Total Value Locked fell by 13% to $74 billion. At the same time, the volume of decentralized exchanges fell by 27% to $17.4 billion each week. Critics say that BNB Chain and Solana are becoming more competitive, but Ethereum is still clearly in charge when it comes to layer-2 ecosystems.
The move to layer-2 solutions like Base, Arbitrum, and Polygon brings both chances and worries. These scaling solutions greatly increase capacity—Base alone handles 102 million transactions per week—but they also lessen demand for base layer fees, making Ethereum’s burn mechanism less effective when the mainnet is less active.
Ethereum Outlook: Strategic Support Zone and Uncertain Macro Environment
A lot of support levels are coming together around the current pricing. The $2,895 accumulation cost base is slightly below that, and if main support fails, there is a deeper demand zone between $2,400 and $2,600. The 50-week moving average near $3,500 seems to be the first line of defense. If the price breaks through that level, it would show that bullish momentum is back.
If Ethereum briefly drops to the $2,895 level, analysts say it probably won’t stay there long because of what has happened in the past. However, a long-term recovery depends a lot on less global uncertainty and the eventual infusion of cash by central banks. If the economy stabilizes and money starts to flow back into risky assets, Ethereum looks like it will be able to challenge the $3,900 mark again.
- Check out our free forex signals
- Follow the top economic events on FX Leaders economic calendar
- Trade better, discover more Forex Trading Strategies
- Open a FREE Trading Account
- Read our latest reviews on: Avatrade, Exness, HFM and XM
Related Articles


Sidebar rates
Related Posts
